
The social network is now scanning links to see if they contain “disruptive, shocking or malicious ads” and little real content.
Facebook’s quest to rid the News Feed of misinformation and misleading content has a new target: websites that are littered with “disruptive, shocking or malicious ads,” and that offer little actual content.
Beginning today, the social network will use artificial intelligence to determine if links shared on the social network direct people to websites that offer a “low quality web page experience” due to the nature of the ads and content being offered. Links that meet the criteria will show up lower in the News Feed, and will not be eligible to to be turned into an ad on Facebook.
The type of ads being targeted by Facebook most frequently appear in the form of content-recommendation ad units. These boxes placed adjacent to articles offer a headline and striking thumbnail image meant to entice people to click. The low-end variety of these ads use sexualized and sometimes shocking images, as well as celebrities, and misleading headlines to capture attention.
Here, for example, is a set of ads served by Content.ad on a fake news article:

A recent report from BuzzFeed News found content-recommendation ads are the primary way fake news sites are making money from their articles. A study from ChangeAdvertising.org also found that these types of ads, though not necessarily the lowest-quality versions of them, are present on more than 80% of the top 50 news websites in the US.
“We’re looking at the content of the ads themselves — are the ads these gross toenail fungus ads, are these sexually suggestive ads,” Greg Marra, a Facebook product manager who works on News Feed integrity, told BuzzFeed News. “We also look at ads in relation to the content on the page. Is it a page that has basically no substantive content and is full of these ads?”
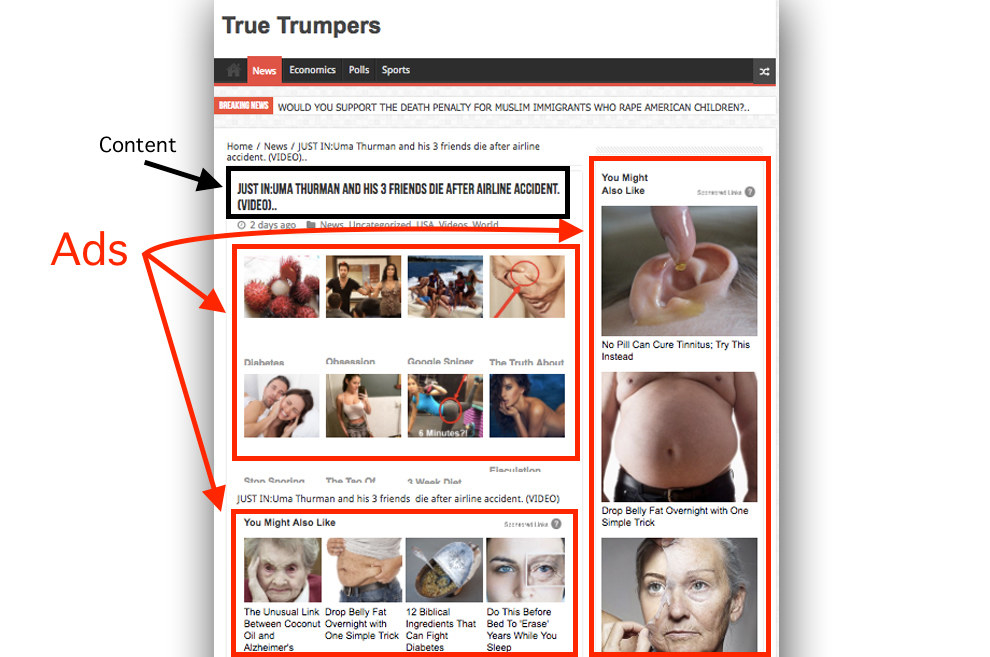
BuzzFeed News recently profiled exactly the kind of site Facebook is now targeting. TrueTrumpers.com is a pro-Trump website run from Eastern Europe that often publishes completely false headlines meant to grab attention on Facebook. But once a person clicks through they are brought to a webpage that is littered with content ad units and that often contains no article text other than the false or misleading headline. The site also triggers a pop-up ad when a visitor clicks anywhere on the page.
A hoax from the site about actor Uma Thurman dying in a plane crash contains at least four different Content.ad units, three of which are displayed to the user before they see the text of the (fake) article:
Marra said he was familiar with True Trumpers as a result of the BuzzFeed News story, but declined to comment on the site specifically. However, the large Facebook page that was used to promote True Trumpers content was recently shut down by the company. A Facebook spokesperson said this was as a result of “fake account and spam violations.”
Marra said Facebook’s intention isn’t to single out content-recommendation ads as a whole — just the lowest-quality offerings that are draped all over a webpage by publishers in order to increase their revenue.
“This isn’t [targeting] every webpage that has a content ad network on it,” Marra said. “…. We’re focused on the worst of the worst of this segment.”
He described bad-faith players as “a group of people who are not trying to create news websites that are trying to establish a long-term relationship with you the reader. They are really just trying to get the click and monetize the click.”
Marc Goldberg, the CEO of Trust Metrics, a company that evaluates online publishers and apps for quality, told BuzzFeed News that Facebook’s decision to down rank links from sites with low-quality ads could help choke off revenue for fake sites and fraudulent publishers.
“Fake publishing, fake news — there is a tremendous underbelly there that continues to siphon off ad dollars,” he said. “Cutting it off from parts of the ecosystem will be very, very helpful.”
He also said Facebook’s effort could be positive for the higher-end content-recommendation ad companies, and punish bad players that trick users with misleading ads.
“Recommendation engines that have stricter policies will be rewarded because now they’re not playing against competition that doesn’t care about the end user or the advertisers,” Goldberg said. “Ultimately this potentially the improves the user trust downstream, where now you’re going to see a lot less of these ads designed to produce curiosity clicks. That can help earn back the trust of advertisers and users.”
Facebook’s Marra said the product team used data collected from “hundreds of thousands links with disruptive, shocking, or sexual ads and not a lot of content” to come up with criteria that will be used to scan links being shared on the platform.
“People will hopefully see less of this kind of junk that can clog up their feed,” he said.
By Craig Silverman
Craig Silverman is Media Editor for BuzzFeed News and is based in Toronto. Contact Craig Silverman at [email protected].


")