By
Want to know if your Instagram Stories content is working? Wondering how to make sense of Instagram Stories Insights?
In this article, you’ll discover seven key Instagram story metrics that reveal what content piqued users’ interest, where interest may have dropped off, and whether people are taking action and engaging with your stories.
#1: Find Out How Many People Watch Your Entire Instagram Story
The completion rate metric can give you a feel for how engaging your Instagram Stories content is. A high completion rate means people are taking the time to watch or tap through each slide (a single photo or video posted on your story) until reaching the end. This can help you determine whether you’re posting too many slides or the right kind of content for your audience.
To calculate this metric, divide the total number of viewers of your last Instagram story slide by the number of people who saw the first slide.
reach of last slide / reach of first slide = completion rate
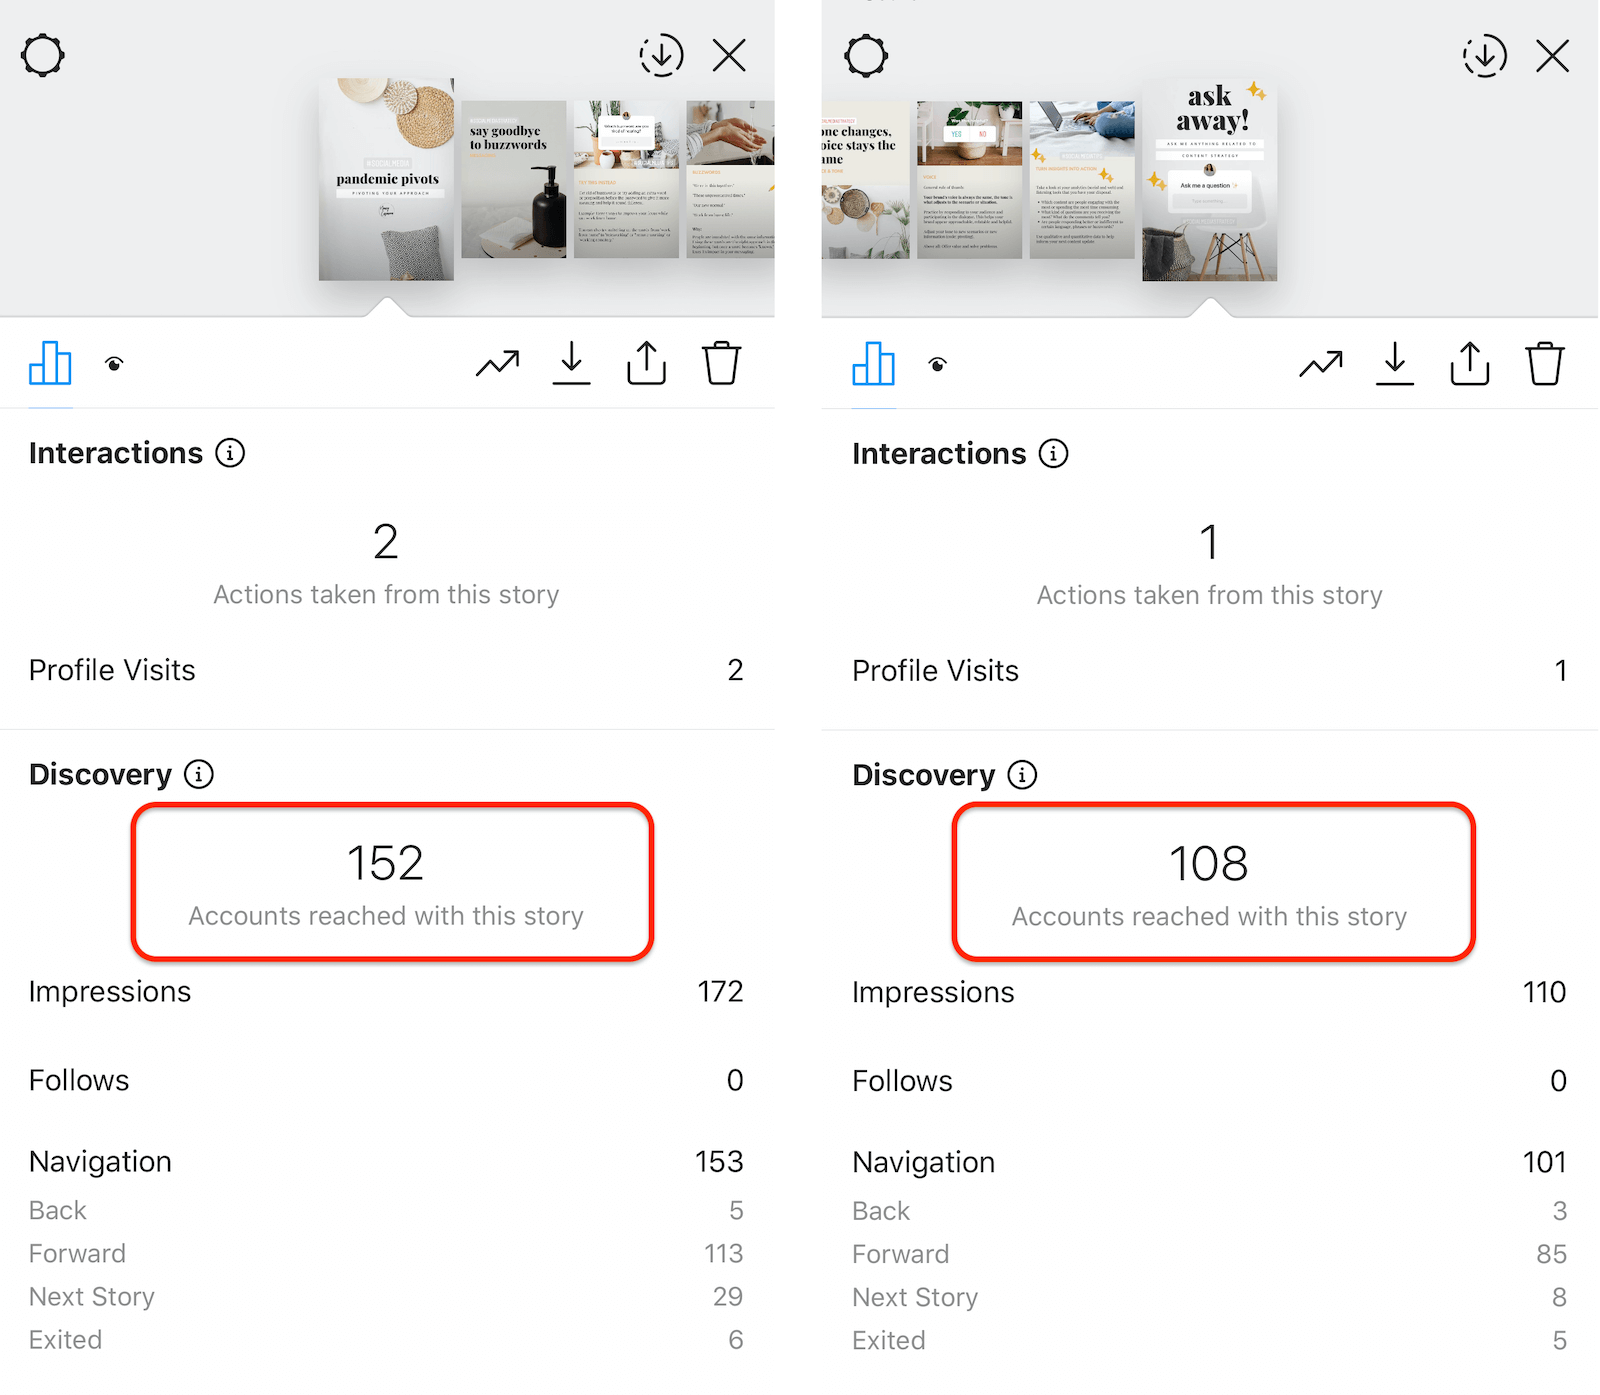
Let’s say your first Instagram story slide had a reach of 152 and your last slide had a reach of 108. Your completion rate would be 71%.
Example: 108 / 152 x 100 = 71% completion rate
Upload a Complete Series at Once
When posting to Instagram Stories, batch-upload all of the slides in a series instead of posting them individually throughout the day. By uploading them in one segment, you can more easily determine the completion rate and analyse how the series performed from beginning to end.
Click HERE to read the remainder of the article.