Tag

Data Science

Browsing

Data science is a new interdisciplinary field of research that focuses on extracting value from data, integrating knowledge and methods from computer science, mathematics and statistics, and an application domain. Machine learning is the field created at the intersection of computer science and statistics, and it has many applications in data science when the application domain is taken into consideration.

From a historical perspective, machine learning was considered, for the past 50 years or so, as part of artificial intelligence. It was taught mainly in computer science departments to scientists and engineers and the focus was placed, accordingly, on the mathematical and algorithmic aspects of machine learning, regardless of the application domain. Thus, although machine learning deals also with statistics, which focuses on data and does consider the application domain, up until recently, most machine learning activities took place in the context of computer science, where it began, and which focuses traditionally on algorithms.

Two processes, however, have taken place in parallel to the accelerated growth of data science in the last decade. First, machine learning, as a sub-field of data science, flourished and its implementation and use in a variety of disciplines began. As a result, researchers realized that the application domain cannot be neglected and that it should be considered in any data science problem-solving situation. For example, it is essential to know the meaning of the data in the context of the application domain to prepare the data for the training phase and to evaluate the algorithm’s performance based on the meaning of the results in the real world. Second, a variety of population began taking machine learning courses, people for whom, as experts in their disciplines, it is inherent and essential to consider the application domain in data science problem-solving processes.

Teaching machine learning to such a vast population, while neglecting the application domain as it is taught traditionally in computer science departments, is misleading. Such a teaching approach guides learners to ignore the application domain even when it is relevant for the modelling phase of data science, in which machine learning is largely used. In other words, when students learn machine learning without considering the application domain, they may get the impression that machine learning should be applied this way and become accustomed to ignoring the application domain. This habit of mind may, in turn, influence their future professional decision-making processes.

For example, consider a researcher in the discipline of social work who took a machine learning course but was not educated to consider the application domain in the interpretation of the data analysis. The researcher is now asked to recommend an intervention program. Since the researcher was not educated to consider the application domain, he or she may ignore crucial factors in this examination and rely only on the recommendation of the machine learning algorithm.

Other examples are education and transportation, fields that everyone feels they understand. As a result of a machine learning education that does not consider the application domain, non-experts in these fields may assume that they have enough knowledge in these fields, and may not understand the crucial role that professional knowledge in these fields plays in decision-making processes that are based on the examination of the output of machine learning algorithms. This phenomenon is further highlighted when medical doctors or food engineers, for example, are not trained or educated in machine learning courses to criticize the results of machine learning algorithms based on their professionalism in medicine and food engineering, respectively.

We therefore propose to stop teaching machine learning courses to populations whose core discipline is neither computer science nor mathematics and statistics. Instead, these populations should learn machine learning only in the context of data science, which repeatedly highlights the relevance of the application domain in each stage of the data science lifecycle and, specifically, in the modelling phase in which machine learning plays an important role.

If our suggestion, to offer machine learning courses in a variety of disciplines only in the context of data science, is accepted, not only will the interdisciplinarity of data science be highlighted, but the realization that the application domain cannot be neglected in data science problem-solving processes will also be further illuminated.

Don’t teach machine learning! Teach data science!

Orit Hazzan is a professor in the Technion’s Department of Education in Science and Technology; her research focuses on computer science, software engineering, and data science education. Koby Mike is a Ph.D. student at the Technion’s Department of Education in Science and Technology; his research focuses on data science education.

Sourced from Communications of the ACM

By

A machine learning engineer is a programmer proficient in building and designing software to automate predictive models. They have a deeper focus on computer science, compared to data scientists.

Machine Learning Engineering has grown in great popularity and is surpassing Data Science. The job title is high in demand with many people from Data Science careers transitioning to become Machine Learning Engineers. It is currently #6 in the top 50 Best Jobs in America, according to glassdoor.

A Machine Learning (ML) Engineer is a programmer proficient in building and designing software to automate predictive models. They have a deeper focus on computer science, in comparison to Data Scientists.

The majority of ML Engineers come from one of two backgrounds. The first is those with a Ph.D. in Data Science, Software Engineering, Computer Science, and/or Artificial Intelligence. The other is people who have prior experience as either a Data Scientist or Software Engineer who has transitioned into the role.

What Does an ML Engineer Do?

A Data Scientist and ML Engineer both work with dynamic data sets, carry out complex modelling, and have exceptional data management skills.

The main role of an ML engineer is to design software to automate predictive models which help carry out future predictions. This is how the ‘machine’ ‘learns’ from ‘engineering’.

The sub-tasks included in doing this include:

  • Researching ML algorithms and tools and how they can be implemented.
  • Selecting the appropriate data sets
  • Selecting data representation methods
  • Verifying the quality of the data
  • Identifying the distribution in the data and how it affects model performance.
  • Iterating training on ML systems and models
  • Perform statistical analysis
  • Fine-tuning the model
  • Improving existing ML frameworks and libraries

What Skills Do You Need To Be A Successful ML Engineer?

There are a variety of skills required to become an ML Engineer.

Programming Skills

You need to have knowledge in multiple programming languages such as C++, Python, and Java with other programming languages such as R and Prolog which have become important elements in Machine Learning. The more programming languages you know, the better; however that can require a lot of studying.

Statistics

Machine Learning has a heavier focus on computer science, using probability and other statistical tools to help build and validate models. Machine learning algorithms are an extension of statistical modelling procedures therefore having a good understanding of the foundations of statistics and maths is important.

Problem Solvers

There are going to be times when models fail and it can become very complicated, therefore ML Engineers need to be good problem solvers. Instead of giving up, solving the problem efficiently by understanding the issue at hand and developing these approaches to help you save time and reach your goal faster.

Understand Data

ML Engineers quickly gander through large data sets being able to identify patterns to help them understand what next steps to take to produce meaningful outcomes. Using tools such as Excel, Tableau, and Plotly can also be used to provide greater insight into the data.

How To Start Your Career as an ML Engineer

How to start your career as an ML Engineer
David Iskander via Unsplash

Traditional route: University

Desirable degrees for ML engineers include Mathematics, Data Science, Computer Science, Statistics, and Physics. These degrees provide ML Engineers with the foundations, aswell as skills in programming, statistical tools, and analysis.

If you would like to get a better insight on the type of content you will learn at University, have a read of this article: Free University Data Science Resources.

Once you have completed a degree, you will need to build your skills and experience in fields such as Software Engineering, Data Scientist, etc. ML Engineers require a few years of experience with a high level of proficiency in programming to be successful.

You can further increase your knowledge by getting a Master’s degree in Data Science, Software Engineering, and/or a Ph.D. in Machine Learning.

Modern tech route: e-Learning

With the demand for tech experts in this day and age, another possibility is independent and/or e-learning. This can be done through BootCamps, online courses, Youtube, and more.

If you are looking to learn through YouTube, there are a variety of YouTube channels that can help you get there. There are YouTubers such as John Starmer, Krish Naik, and more. If you would like to know more, have a read of this article: Top YouTube Channels for Learning Data Science.

There are also a variety of online courses, some of which are provided by Universities. This shows the demand for tech experts as Universities have taken the time to create courses to help meet this demand. With the new remote lifestyle, online courses are becoming more and more popular to help accelerate people’s careers.

An excellent platform that has recently interested me is Great Learning, which provides courses in Data Science & Business Analytics, AI & Machine Learning, Cloud Computing, Software Development, and more. One of their most popular Machine Learning courses is: Data Science and Machine Learning: Making Data-Driven Decisions Program.

ML Engineers have to know a lot of knowledge surrounding Machine Learning, and the different types of algorithms. If you would like to know more about the type of algorithms you will learn in Machine Learning, have a read of this article: Popular Machine Learning Algorithms.

Books

Although many things have moved online, fewer and fewer people read books. Books are a great way to learn, however, it can be difficult to know which book to choose. I would highly recommend the book Machine Learning for Absolute Beginners by Oliver Theobald.

If you would like more Machine Learning book recommendations for different levels of learning; beginners, intermediate, and experts, have a read of this article: Machine Learning Books You Need To Read In 2022

It’s Not An Easy Route, But It’s Worth It

Becoming an ML Engineer won’t happen overnight, but once you have obtained the correct qualifications, skills, and experience, you will be in a field that provides you with a solid future. It requires a lot of hard work and determination, all you need to do is put in the work.

Nisha Arya is a Data Scientist and Freelance Technical Writer. She is particularly interested in providing Data Science career advice or tutorials and theory based knowledge around Data Science. She also wishes to explore the different ways Artificial Intelligence is/can benefit the longevity of human life. A keen learner, seeking to broaden her tech knowledge and writing skills, whilst helping guide others.

Feature Image Credit: rawpixel

By

Sourced from KDnuggets

This is probably the most common question I got asked beside “How did you land your job in Data Science/ Data Analytics?” I will write another blog on my job hunting journey, so this will focus on how to get the industry exposure without that gig yet.

I gave a talk on this topic before at DIPD @ UCLAthe student organization dedicated to increasing diversity and inclusion in the fields of Product and Data that I co-founded. However, I aim to expand this topic and make it accessible to a broader audience.

And there it goes, I hope this post will potentially inspire more and more data enthusiasts to start their own blogs.

This may be a tough time for many of us, but it’s also a prime time to turbocharge and level up your skill sets in data science and analytics. If your employment got impacted at this time, treat the unfortunate as a great opportunity to take a break, reflect and kickstart your personal project — things that are luxurious when time does not allow.

“When one door closes, another opens” — Alexander Graham Bell

Hardship does not determine who you are, it’s your attitude and perseverance that define your values. Let’s get right into it!

Where to start?

Photo by Carl Heyerdahl via Unsplash

Start small and scale up

Before we start any project, first narrowing down your interests. This is your personal project so you will have full autonomy over it. Find something that makes you tick and gets you motivated to devote your time!

There will be a lot of challenges along the way that may discourage or sidetrack you from accomplishing the project, the thing that keeps you going should be the analysis topic that strongly aligns with your interest. It does not have to be something out of the world. Ask yourself what is important to you and why should we care about it.

When I first started, I knew that I wholeheartedly care about mental health and the ways to gain more mindfulness. So I dug deeper into analyzing the top 6 guided meditation apps to understand which one will be most suitable for my preferences.

Getting inspirations

Photo by Road Trip with Raj via Unsplash

Read, read, and read!

One of the most important key factors that I learned through my research assistant position at CRESST UCLA is to balance the workload between analysis and literature review. What this means is that we need to find what has been done in the past and figure out which additions or unique aspects you can contribute on top of the findings. My reading sources vary from Medium, Analytic Vidhya, statistics books to any relevant sources that I can find on the internet.

Take my Subtle Couple Traits analysis for example. There has been some work done in the space of music taste analysis via Spotify API, but no one has really delved into movies yet. So I took this chance and discovered the intersection of our couple’s cult favorites for music and movies.

Finding the right toolbox

Photo by Giang Nguyen via MinfulR on Medium

Now you get to this step where you need to figure out which data to collect and find the right tools for the job. This part has always resonated intrinsically with my industry experience as a data analyst. It’s the most challenging and time-consuming part indeed.

My best tip for this stage of analysis is to ask a lot of practical questions and come up with some hypotheses that you need to answer or justify through data. We have to also be mindful of the feasibility of the project, otherwise, you can be more flexible in terms of tweaking your approach towards a more doable one.

Note that you can use the programming language that you are most comfortable with 🙂 I believe that either Python or R has its own advantages and great supporting data packages.

An example from my past project can crystalize this strategy. I was curious about the non-pharmaceutical factors that correlate to the suppression of COVID-19 so I listed out all of the variables I can think of such as weather, PPEs, ICU beds, quarantines, etc. then I began massive research on the open-source data sets.

“All models are wrong, but some are useful” — George Box

Since I did not have a background in public health, building predictive models for this type of pandemic data was a huge challenge. I first started with some models I’m familiar with such as random forest or Bayesian ridge regression. However, I discovered that pandemic typically follows the trend of a logistic curve in which the cases grow exponentially over a period of time until it hits the inflection point and levels out. This refers to the compartmental models in epidemiology. It took me almost 2 weeks to learn and apply this model to my analysis but the result was extremely mesmerizing. And I eventually wrote a blog about it.

The process

If you are working in the Data Science/Analytics field, this is not new to you — “80% of a data scientist’s time consists of preparing (simply finding, cleansing, and organizing data), leaving only 20% to build models and perform analysis.”

Photo by Impulse Creative

The process of cleaning data may be cumbersome, but when you get it right, your analysis will be more valuable and significant. Here’s the typical process I take for my analysis workflow:

1) Collecting Data

2) Cleaning Data

Many more…

3) Project-based techniques

  • (NLP) Sentimental analysis, POS, topic modeling, BERT, etc.
  • (Predictions) Classification/Regression model
  • (Recommendation System) Collaborative Filtering, etc.

Many more…

4) Write up insights and recommendations

Connecting the dots

This is the most important part of the analysis. How do we connect the analysis insights into a real-life context and making actionable recommendations? Regardless of your project’s focus, whether it’s about machine learning, deep learning or analytics, what problem is your analysis/model trying to solve?

Photo by Quickmeme

Imagining that we build a highly complex model to predict how many Medium readers will clap for your blog. Okay, so how’s this important?

Link it to potential impacts! If your post receives more endorsement from claps, it may get curated and featured more often on Medium platform. And if more paying Medium readers find your blog, you can probably earn more money through the Medium Partner Program. Now that’s an impact!

However, it’s not always about profit-driven impact, it could be social, health, or even environmental impact. This is just one example of how you can make the connections between technical concepts with real-world implementation.

Roadblocks

You may hit a wall at some points during the journey. My best piece of advice is to proactively seek help!

Besides from reaching out to friends, colleagues, or mentors to ask for advice, I often found it helpful to search or post questions on online Q&A platforms like Stack Overflow, StackExchange, Github, Quora, Medium, you name it! While seeking for solutions, be patient and creative. If the online solutions have not yet solved your problems, try to think of another way to customize the solution for the characteristics of your data or the version of the code.

The art of writing is rewriting.

When I first published my first data blog to Medium, I found myself re-visiting my post and fixing some sentences or wording here and there. Don’t be discouraged if you notice some typos or grammar mistakes after releasing it, you can always go back and edit!

Since it is our personal project, there’s no obligation on whether you must finish it. Hence, prioritization and disciplines play a crucial role throughout the journey. Set a clear goal for your project and lay out a timeline to achieve it. At the same time, don’t spread yourself too thin since it may cause you to lose interest.

Understand your timeline and capacity! I often push my personal project in a sprint of 2 to 4 weeks to finish during break or the weekends. In order to organize your sprint and track your progress, you can refer to some Agile framework that can be found through collaboration software like Trello or Asana. As long as you make progress even the smallest one, your success shall flourish some day. So keep going and don’t give up!

Closing Remarks

The first step is always the hardest. If you don’t think that the project is ready yet, give yourself some time to fine-tune and share it!

Nothing will be perfect at first. But by shipping it to the audiences, you would know what to improve for later projects — I adopted this principle wholeheartedly from product management perspectives.

I used to be not good at communicating my thoughts structurally and clearly (which I’m still trying to improve), but by pushing myself out of the comfort zone, I have gone extra miles from where I was. I hope this will, to some degree, inspire you to start your first data blog. Believe in yourself, be brave and reach out to me or anyone in your network if you need help along the way!

“Faith is taking the first step even when you don’t see the whole staircase.” — Martin Luther King

Photo by Glen McCallum via Unsplash

By Giang Nguyen

Sourced from towards data science

By

Data science is a growing speciality with plenty of opportunity. Read some insights from an industry expert on how to build a career in this promising field.

Data science is a field offering plenty of diverse career path opportunities, and Glassdoor.com named it the number one job in several recent years.

Northeastern University lists on its site a comprehensive set of potential jobs related to data science including business intelligence developer, data/applications/infrastructure architect, machine learning scientist/engineer, and, of course, the traditional data scientist role.

SEE: Big data management tips (free PDF) (TechRepublic)

My colleague Alison DeNisco Rayome covered data science last year and provided a plethora of details related to the topic. I recently spoke with Martijn Theuwissen, co-founder of DataCamp, a data science educational organization, to learn more about the concept.

Scott Matteson: What skills are needed to be a data scientist?

Martijn Theuwissen: There is a common misconception that to become a data scientist one needs to know statistics, linear algebra, calculus, programming, databases, machine learning, I could go on. Some even say a Ph.D. is required. This couldn’t be further from the truth.

In fact, anyone can become a data scientist. All you need is a learning plan with measurable objectives, and a basic understanding of the popular data science languages like SQL, Python, and R.

But let’s step back a bit to see what data science really is. Data science can often be segmented as descriptive analytics, predictive analytics, and prescriptive analytics.

  • Descriptive analytics is essentially describing data that your company already has in the form of reports, dashboards, or other ways to share data visualizations and summary statistics.
  • Predictive analytics is the realm of prediction and machine learning: For example, classifying whether an email is spam or not, based on its content, whether a customer will churn, based on interactions with your company, or whether a tumor is benign or malignant, based on diagnostic imaging.
  • Prescriptive analytics, or decision science, brings rigor to decision making by tying it to the data world. Sure, machine learning is sexy, but the lion’s share of the value data science has created today across most verticals is actually in descriptive analytics by serving relevant summary statistics, visualizations and dashboards to relevant internal stakeholders.

SEE: What does a data scientist do? We talked to one to learn about this popular and lucrative field (TechRepublic)

And anybody can do this! I’ve seen data scientists on marketing, commercial, and product teams need to redefine their own roles as their “non-technical” teammates have learned some SQL and data visualization in Python or R to do work and create value that was previously inconceivable. And these are just some of the skills that we want to help build data fluency throughout the world.

Scott Matteson: Can you look within your organization to find the useful skills? Should enterprises turn to education and training?

Martijn Theuwissen: Yes to both. There are data scientists at every company. Instituting a mentor program, for example, combined with a continuous learning curriculum can greatly improve data fluency across an organization.

And this is no longer an option — it’s an imperative. Data is king in business. Data science is a means by which you can use data to make business decisions. Without the basic data science skills, employees can’t make these important decisions.

As your team becomes more comfortable with the language of data, they’ll be more comfortable bringing data to bear on important business decisions. It will become clear that some team members are more comfortable using data skills than others are. Encourage the proficient ones to mentor others. Even at DataCamp, where data science is our business, some people don’t work with data continuously. When they need help on a complex problem, they pair up with those who do.

SEE: How to fail as a data scientist: 3 common mistakes (TechRepublic)

It’s all about shared tools, skills and responsibilities — they can dramatically improve communication and understanding between employees, which ultimately improves workplace culture.

Scott Matteson: Can employees be trained in data science?

Martijn Theuwissen: Absolutely. But first, companies need to create awareness that data science today is not exclusive to data scientists. In fact, many tasks at companies require some level of data science—finance, marketing, operations, and HR, just to name a few. It’s a cultural challenge as much as a skills challenge.

Second, companies need to implement upskilling initiatives that fit the lifestyle of their employees. Solutions like DataCamp that provide on-demand and interactive learning options were specifically built for busy people. This reflects a fundamental shift in the upskilling and reskilling initiatives taking place in many industries. We’re seeing a transition from L&D functions creating in-person training material to them, curating personalized content for their employees using online resources.

SEE: Oracle using data science to give retailers an intelligence edge (TechRepublic)

Most importantly, don’t take your foot off the gas pedal. Learning isn’t a one-off, especially in a dynamic space like data science. Make sure the programs you’ve implemented are repeatable and that you’re measuring success and growth. In the future of work, continuous learning is the norm. The number of tools developed and skills needed to solve real business problems is growing quickly. We’ve entered an age where continual learning is essential to staying professionally relevant. This is true generally, but even more so in the data world.

Scott Matteson: Do data scientists need a Ph.D.?

Martijn Theuwissen: There are no shortcuts to writing code, but with practice, anyone can build the skills needed to solve problems using data, especially with the right education tools.

For example, one of our employees pivoted from account executive to data scientist using DataCamp. We’ve also heard similar stories from our customers. Then you have examples of well-known data scientists without formal degrees. Cloudera Co-founder Jeff Hammerbacher, election forecaster Nate Silver (of FiveThirtyEight), and Moneyball brain Paul DePodesta are three that come to mind.

This is not to say there isn’t value in having a university degree in data science. In fact, we give DataCamp subscriptions for free to many universities because we stand for democratizing data science, regardless of the education medium.

Scott Matteson: Is being a data scientist about the skill, dedication, understanding, or education? A mix?

Martijn Theuwissen: A major part of being an effective data scientist, which goes beyond having any sort of degree or training program, is knowing how to conduct conversations and ask the right questions around such topics as:

  • Data generation, collection, and storage
  • What data looks and feels like to data scientists and analysts,
  • Statistical intuition and common statistical pitfalls
  • Model building, machine learning, and artificial intelligence (AI)
  • The ethics of data, big and small

Monica Rogati, who’s a total rock star in our field, wrote a great article on this topic called Data Science Hierarchy of Needs that’s worth seeking out. I’m biased, of course, but I also highly recommend our brand new Data Science for Business Leaders course to learn more.

SEE: Top 5 things to know about data science (TechRepublic)

Scott Matteson: Can you describe what the daily activities of a data scientist are, using subjective examples?

Martijn Theuwissen: Today’s data scientists add value on a daily basis by conducting data collection and data cleaning; constructing dashboards and building reports; data visualization; statistical inference; communicating results to key stakeholders; and providing quantifiable evidence to decision makers on their results.

Data scientists in the tech industry now know how data science works and the value it provides. They begin each day by putting a solid data foundation in place–one that will conduct robust analytics. From there they utilize online experiments and other methods that will result in sustainable growth. Last, but not least, they construct machine learning pipelines and customized data products to help them gain a greater understanding of their business and customers and make better decisions.

Scott Matteson: How long would it take for an individual to learn the trade and launch a career in data science?

Martijn Theuwissen: A reasonable estimate is spending six months dedicated to learning full time and completing projects. This would also include writing them out in Jupyter / R Markdown notebooks. The work should also be published on github and a personal blog. All of that work would equip someone well for an entry-level position like junior data analyst or junior data scientist. From that point on, the key is continuous learning that includes all of the latest tools, techniques, concepts, communications, and questions.

Feature Image Credit: NanoStockk, Getty Images/iStockphoto

By

Sourced from TechRepublic

By fuyili.

Business Intelligence is a process of transforming the data into information and turning information into actionable insights. However, a successful business intelligence strategy is only on the premise that we have enough valuable data in a structured format for us to generate in-depth analysis. But how? As of today, the amount of data scattering across the internet is far beyond our capacity to consume, let alone digging out valuable information. But don’t worry! If there’s a problem, there is a solution.

Web data extraction refers to an automated process to collect data that replaces the traditional way of manual work of copy and pastes. There are many ways to achieve automation, either writing code by yourself or hiring a freelancer to do the job for you. However, the most cost-effective method would be a SaaS to manage the process with a reasonable time.

I list four real-world examples of how web data extraction plays into the system of business intelligence.

Table of Contents
· Social Media Intelligence
· Price Intelligence
· Brand Intelligence
· Product Intelligence

Social Media Intelligence
Social media data comes with many forms. They can be blogs, reviews, posts, images, comments, social engagements and more. Social media data extraction can explore business opportunities, track competitors, monitor consumer sentiment by extracting this information on a regular basis.

Price Intelligence
E-commerce practitioners often need to look out for prices from single or multiple websites. They also need to compare competitors’ with what they offer daily to optimize their marketing efforts accordingly. Web data extraction makes it possible to track prices every few minutes and update the information to your database. This allows you to monitor the price volatility and make a dynamic price strategy.

Brand Intelligence
Business needs to track and improve their presence and visibility across social media. Data extraction can collect positive, negative mentions and the people who mention the product on time. As such, you can react to grievances in time. Even better, build a relationship with those who speak highly about your brand, and turn them to your brand evangelists.

Product Intelligence
If you need to track how your competitors are handling their products, you can leverage web data extraction to collect the product information across multiple websites including Amazon, eBay, Walmart, etc. As a result, you can take a better assortment decision.

These are just a few examples of data extraction applications in business intelligence. But please be aware that the business intelligence environment is way more complex. It involves methodology, applications, and technologies to enable entire information processing. And a sufficient volume of quality data enables us to draw a conclusion from data analysis, discover patterns and forecast future events, eliminate risk. In this case, data extraction has a great impact on business operations.

Choosing the right method to extract data is crucial. Traditionally, people would write code to extract web data. The most common programming languages would be python or R. These coding-approaches can get you a sheer volume of data at a certain time. Yet, as soon as the structure of the webpages changed, they have to rewrite the code or even have to change the entire approach.

Web pages are constantly changing. They are dynamic, and it challenges us to get data from the internet. In this sense, the data extraction tool would be the most cost-effective method. An intelligent web data extraction tool like Octoparse can achieve real-sense automation(BTW, Octoparse 8.1 is coming soon. Please check Octoparse 8.1 Upcoming Features Announcement). Its advanced features ensure that you can extract data from dynamic websites while also being intuitive and user-friendly without coding.

By fuyili

Sourced from codementor Community

By Benjamin Obi Tayo Ph.D.

ata Science is such a broad field that includes several subdivisions like data preparation and exploration; data representation and transformation; data visualization and presentation; predictive analytics; machine learning, etc. For beginners, it’s only natural to raise the following question: What skills do I need to become a data scientist?

This article will discuss 10 essential skills that are necessary for practicing data scientists. These skills could be grouped into 2 categories, namely, technological skills (Math & Statistics, Coding Skills, Data Wrangling & Preprocessing Skills, Data Visualization Skills, Machine Learning Skills,and Real World Project Skills) and soft skills (Communication Skills, Lifelong Learning Skills, Team Player Skills and Ethical Skills).

Data science is a field that is ever-evolving, however mastering the foundations of data science will provide you with the necessary background that you need to pursue advance concepts such as deep learning, artificial intelligence, etc. This article will discuss 10 essential skills for practicing data scientists.

10 Essential Skills You Need to Know to Start Doing Data Science

1. Mathematics and Statistics Skills

(I) Statistics and Probability

Statistics and Probability is used for visualization of features, data preprocessing, feature transformation, data imputation, dimensionality reduction, feature engineering, model evaluation, etc. Here are the topics you need to be familiar with:

a) Mean

b) Median

c) Mode

d) Standard deviation/variance

e) Correlation coefficient and the covariance matrix

f) Probability distributions (Binomial, Poisson, Normal)

g) p-value

h) MSE (mean square error)

i) R2 Score

j) Baye’s Theorem (Precision, Recall, Positive Predictive Value, Negative Predictive Value, Confusion Matrix, ROC Curve)

k) A/B Testing

l) Monte Carlo Simulation

(II) Multivariable Calculus

Most machine learning models are built with a data set having several features or predictors. Hence familiarity with multivariable calculus is extremely important for building a machine learning model. Here are the topics you need to be familiar with:

a) Functions of several variables

b) Derivatives and gradients

c) Step function, Sigmoid function, Logit function, ReLU (Rectified Linear Unit) function

d) Cost function

e) Plotting of functions

f) Minimum and Maximum values of a function

(III) Linear Algebra

Linear algebra is the most important math skill in machine learning. A data set is represented as a matrix. Linear algebra is used in data preprocessing, data transformation, and model evaluation. Here are the topics you need to be familiar with:

a) Vectors

b) Matrices

c) Transpose of a matrix

d) The inverse of a matrix

e) The determinant of a matrix

f) Dot product

g) Eigenvalues

h) Eigenvectors

(IV) Optimization Methods

Most machine learning algorithms perform predictive modeling by minimizing an objective function, thereby learning the weights that must be applied to the testing data in order to obtain the predicted labels. Here are the topics you need to be familiar with:

a) Cost function/Objective function

b) Likelihood function

c) Error function

d) Gradient Descent Algorithm and its variants (e.g. Stochastic Gradient Descent Algorithm)

Find out more about the gradient descent algorithm here: Machine Learning: How the Gradient Descent Algorithm Works.

2. Essential Programming Skills

Programming skills are essential in data science. Since Python and R are considered the 2 most popular programming languages in data science, essential knowledge in both languages are crucial. Some organizations may only require skills in either R or Python, not both.

(I) Skills in Python

Be familiar with basic programming skills in python. Here are the most important packages that you should master how to use:

a) Numpy

b) Pandas

c) Matplotlib

d) Seaborn

e) Scikit-learn

f) PyTorch

(ii) Skills in R

a) Tidyverse

b) Dplyr

c) Ggplot2

d) Caret

e) Stringr

(iii) Skills in Other Programming Languages

Skills in the following programming languages may be required by some organizations or industries:

a) Excel

b) Tableau

c) Hadoop

d) SQL

e) Spark

3. Data Wrangling and Proprocessing Skills

Data is key for any analysis in data science, be it inferential analysis, predictive analysis, or prescriptive analysis. The predictive power of a model depends on the quality of the data that was used in building the model. Data comes in different forms such as text, table, image, voice or video. Most often, data that is used for analysis has to be mined, processed and transformed to render it to a form suitable for further analysis.

i) Data Wrangling: The process of data wrangling is a critical step for any data scientist. Very rarely is data easily accessible in a data science project for analysis. It’s more likely for the data to be in a file, a database, or extracted from documents such as web pages, tweets, or PDFs. Knowing how to wrangle and clean data will enable you to derive critical insights from your data that would otherwise be hidden.

ii) Data Preprocessing: Knowledge about data preprocessing is very important and include topics such as:

a) Dealing with missing data

b) Data imputation

c) Handling categorical data

d) Encoding class labels for classification problems

e) Techniques of feature transformation and dimensionality reduction such as Principal Component Analysis (PCA) and Linear Discriminant Analysis (LDA).

4. Data Visualization Skills

Understand the essential components of a good data visualization.

a) Data Component: An important first step in deciding how to visualize data is to know what type of data it is, e.g. categorical data, discrete data, continuous data, time series data, etc.

b) Geometric Component: Here is where you decide what kind of visualization is suitable for your data, e.g. scatter plot, line graphs, barplots, histograms, qqplots, smooth densities, boxplots, pairplots, heatmaps, etc.

c) Mapping Component: Here you need to decide what variable to use as your x-variable and what to use as your y-variable. This is important especially when your dataset is multi-dimensional with several features.

d) Scale Component: Here you decide what kind of scales to use, e.g. linear scale, log scale, etc.

e) Labels Component: This include things like axes labels, titles, legends, font size to use, etc.

f) Ethical Component: Here, you want to make sure your visualization tells the true story. You need to be aware of your actions when cleaning, summarizing, manipulating and producing a data visualization and ensure you aren’t using your visualization to mislead or manipulate your audience.

5. Basic Machine Learning Skills

Machine Learning is a very important branch of data science. It is important to understand the machine learning framework: Problem Framing; Data Analysis; Model Building, Testing &Evaluation; and Model Application. Find out more about the machine learning framework from here: The Machine Learning Process.

The following are important machine learning algorithms to be familiar with.

i) Supervised Learning (Continuous Variable Prediction)

a) Basic regression

b) Multiregression analysis

c) Regularized regression

ii) Supervised Learning (Discrete Variable Prediction)

a) Logistic Regression Classifier

b) Support Vector Machine Classifier

c) K-nearest neighbor (KNN) Classifier

d) Decision Tree Classifier

e) Random Forest Classifier

iii) Unsupervised Learning

a) Kmeans clustering algorithm

6. Skills from Real World Capstone Data Science Projects

Skills acquired from course work alone will not make your a data scientist. A qualified data scientist must be able to demonstrate evidence of successful completion of a real world data science project that includes every stages in data science and machine learning process such as problem framing, data acquisition and analysis, model building, model testing, model evaluation, and deploying model. Real world data science projects could be found in the following:

a) Kaggle Projects

b) Internships

c) From Interviews

7. Communication Skills

Data scientists need to be able communicate their ideas with other members of the team or with business administrators in their organizations. Good communication skills would play a key role here to be able to convey and present very technical information to people with little or no understanding of technical concepts in data science. Good communication skills will help foster an atmosphere of unity and togetherness with other team members such as data analysts, data engineers, field engineers, etc.

8. Be a Lifelong Learner

Data science is a field that is ever-evolving, so be prepared to embrace and learn new technologies. One way to keep in touch with developments in the field is to network with other data scientists. Some platforms that promote networking are LinkedIn, github, and medium (Towards Data Science and Towards AI publications). The platforms are very useful for up-to-date information about recent developments in the field.

9. Team Player Skills

As a data scientist, you will be working in a team of data analysts, engineers, administrators, so you need good communication skills. You need to be a good listener too, especially during early project development phases where you need to rely on engineers or other personnel to be able to design and frame a good data science project. Being a good team player world help you to thrive in a business environment and maintain good relationships with other members of your team as well as administrators or directors of your organization.

10. Ethical Skills in Data Science

Understand the implication of your project. Be truthful to yourself. Avoid manipulating data or using a method that will intentionally produce bias in results. Be ethical in all phases from data collection, to analysis, to model building, analysis, testing and application. Avoid fabricating results for the purpose of misleading or manipulating your audience. Be ethical in the way you interpret the findings from your data science project.

In summary, we’ve discussed 10 essential skills needed for practicing data scientists. Data science is a field that is ever-evolving, however mastering the foundations of data science will provide you with the necessary background that you need to pursue advance concepts such as deep learning, artificial intelligence, etc.

By Benjamin Obi Tayo Ph.D.

Sourced from Towards Data Science

By Cassie Kozyrkov

Understanding the value of two completely different professions

Statistics and analytics are two branches of data science that share many of their early heroes, so the occasional beer is still dedicated to lively debate about where to draw the boundary between them. Practically, however, modern training programs bearing those names emphasize completely different pursuits. While analysts specialize in exploring what’s in your data, statisticians focus more on inferring what’s beyond it.

Disclaimer: This article is about typical graduates of training programs that teach only statistics or only analytics, and it in no way disparages those who have somehow managed to bulk up both sets of muscles. In fact, elite data scientists are expected to be full experts in analytics and statistics (as well as machine learning)… and miraculously these folks do exist, though they are rare.

Image: SOURCE.

Human search engines

When you have all the facts relevant to your endeavor, common sense is the only qualification you need for asking and answering questions with data. Simply look the answer up.

Want to see basic analytics in action right now? Try Googling the weather. Whenever you use a search engine, you’re doing basic analytics. You’re pulling up weather data and looking at it.

Even kids can look facts up online with no sweat. That’s democratization of data science right here. Curious to know whether New York is colder than Reykjavik today? You can get near-instant satisfaction. It’s so easy we don’t even call this analytics anymore, though it is. Now imagine trying to get that information a century ago. (Exactly.)

When you use a search engine, you’re doing basic analytics.

If reporting raw facts is your job, you’re pretty much doing the work of a human search engine. Unfortunately, a human search engine’s job security depends on your bosses never finding out that they can look the answer up themselves and cut out the middleman… especially when shiny analytics tools eventually make querying your company’s internal information as easy as using Google Search.

Inspiration prospectors

If you think this means that all analysts are out of a job, you haven’t met the expert kind yet. Answering a specific question with data is much easier than generating inspiration about which questions are worth asking in the first place.

I’ve written a whole article about what expert analysts do, but in a nutshell they’re all about taking a huge unexplored dataset and mining it for inspiration.

“Here’s the whole internet, go find something useful on it.”

You need speedy coding skills and a keen sense of what your leaders would find inspiring, along with all the strength of character of someone prospecting a new continent for minerals without knowing anything (yet) about what’s in the ground. The bigger the dataset and the less you know about the types of facts it could potentially cough up, the harder it is to roam around in it without wasting time. You’ll need unshakeable curiosity and the emotional resilience to handle finding a whole lot of nothing before you come up with something. It’s always easier said than done.

Here’s a bunch of data. Okay, analysts, where would you like to begin? Image: Source.

While analytics training programs usually arm their students with software skills for looking at massive datasets, statistics training programs are more likely to make those skills optional.

Leaping beyond the known

The bar is raised when you must contend with incomplete information. When you have uncertainty, the data you have don’t cover what you’re interested in, so you’re going to need to take extra care when drawing conclusions. That’s why good analysts don’t come to conclusions at all.

Instead, they try to be paragons of open-mindedness if they find themselves reaching beyond the facts. Keeping your mind open crucial, else you’ll fall for confirmation bias — if there are twenty stories in the data, you’ll only notice the one that supports what you already believe… and you’ll snooze past the others.

Beginners think that the purpose of exploratory analytics is to answer questions, when it’s actually to raise them.

This is where the emphasis of training programs flips: avoiding foolish conclusions under uncertainty is what every statistics course is about, while analytics programs barely scratch the surface of inference math and epistemological nuance.

Image: Source.

Without the rigor of statistics, a careless Icarus-like leap beyond your data is likely to end in a splat. (Tip for analysts: if you want to avoid the field of statistics entirely, simply resist all temptation to make conclusions. Job done!)

Analytics helps you form hypotheses. It improves the quality of your questions.

Statistics helps you test hypotheses. It improves the quality of your answers.

A common blunder among the data unsavvy is to think that the purpose of exploratory analytics is to answer questions, when it’s actually to raise them. Data exploration by analysts is how you ensure that you’re asking better questions, but the patterns they find should not be taken seriously until they are tested statistically on new data. Analytics helps you form hypotheses, while statistics lets you test them.

Statisticians help you test whether it’s sensible to behave as though the phenomenon an analyst found in the current dataset also applies beyond it.

I’ve observed a fair bit of bullying of analysts by other data science types who seem to think they’re more legitimate because their equations are fiddlier. First off, expert analysts use all the same equations (just for a different purpose) and secondly, if you look at broad-and-shallow sideways, it looks just as narrow-and-deep.

I’ve seen a lot of data science usefulness failures caused by misunderstanding of the analyst function. Your data science organization’s effectiveness depends on a strong analytics vanguard, or you’re going to dig meticulously in the wrong place, so invest in analysts and appreciate them, then turn to statisticians for the rigorous follow-up of any potential insights your analysts bring you.

You need both!

Choosing between good questions and good answers is painful (and often archaic), so if you can afford to work with both types of data professional, then hopefully it’s a no-brainer. Unfortunately, the price is not just personnel. You also need an abundance of data and a culture of data-splitting to take advantage of their contributions. Having (at least) two datasets allows you to get inspired first and form your theories based on something other than imagination… and then check that they hold water. That is the amazing privilege of quantity.

Misunderstanding the difference results in lots of unnecessary bullying by statisticians and lots of undisciplined opinions sold as a finished product by analysts.

The only reason that people with plenty of data aren’t in the habit of splitting data is that the approach wasn’t viable in the data-famine of the previous century. It was hard to scrape together enough data to be able to afford to split it. A long history calcified the walls between analytics and statistics so that today each camp feels little love for the other. This is an old-fashioned perspective that has stuck with us because we forgot to rethink it. The legacy lags, resulting in lots of unnecessary bullying by statisticians and lots of undisciplined opinions sold as a finished product by analysts. If you care about pulling value from data and you have data abundance, what excuse do you have not to avail yourself of both inspiration and rigor where it’s needed? Split your data!

If you can afford to work with both types of data professional, then hopefully it’s a no-brainer.

Once you realize that data-splitting allows each discipline to be a force multiplier for the other, you’ll find yourself wondering why anyone would approach data any other way.

By Cassie Kozyrkov

Head of Decision Intelligence, Google. ❤️ Stats, ML/AI, data, puns, art, theatre, decision science. All views are my own. twitter.com/quaesita

Sourced from Towards Data Science

Sourced from Dimensionless

The Next Generation of Data Science

Quite literally, I am stunned.

I have just completed my survey of data (from articles, blogs, white papers, university websites, curated tech websites, and research papers all available online) about predictive analytics.

And I have a reason to believe that we are standing on the brink of a revolution that will transform everything we know about data science and predictive analytics.

But before we go there, you need to know: why the hype about predictive analytics? What is predictive analytics?

Let’s cover that first.

 Importance of Predictive Analytics


Black Samsung Tablet Computer

By PhotoMix Ltd


According to Wikipedia:

Predictive analytics is an area of statistics that deals with extracting information from data and using it to predict trends and behavior patterns. The enhancement of predictive web analytics calculates statistical probabilities of future events online. Predictive analytics statistical techniques include data modeling, machine learning, AI, deep learning algorithms and data mining.

Predictive analytics is why every business wants data scientists. Analytics is not just about answering questions, it is also about finding the right questions to answer. The applications for this field are many, nearly every human endeavor can be listed in the excerpt from Wikipedia that follows listing the applications of predictive analytics:

From Wikipedia:

Predictive analytics is used in actuarial science, marketing, financial services, insurance, telecommunications, retail, travel, mobility, healthcare, child protection, pharmaceuticals, capacity planning, social networking, and a multitude of numerous other fields ranging from the military to online shopping websites, Internet of Things (IoT), and advertising.

In a very real sense, predictive analytics means applying data science models to given scenarios that forecast or generate a score of the likelihood of an event occurring. The data generated today is so voluminous that experts estimate that less than 1% is actually used for analysis, optimization, and prediction. In the case of Big Data, that estimate falls to 0.01% or less.

Common Example Use-Cases of Predictive Analytics


Components of Predictive Analytics


A skilled data scientist can utilize the prediction scores to optimize and improve the profit margin of a business or a company by a massive amount. For example:

  • If you buy a book for children on the Amazon website, the website identifies that you have an interest in that author and that genre and shows you more books similar to the one you just browsed or purchased.
  • YouTube also has a very similar algorithm behind its video suggestions when you view a particular video. The site identifies (or rather, the analytics algorithms running on the site identifies) more videos that you would enjoy watching based upon what you are watching now. In ML, this is called a recommender system.
  • Netflix is another famous example where recommender systems play a massive role in the suggestions for ‘shows you may like’ section, and the recommendations are well-known for their accuracy in most cases
  • Google AdWords (text ads at the top of every Google Search) that are displayed is another example of a machine learning algorithm whose usage can be classified under predictive analytics.
  • Departmental stores often optimize products so that common groups are easy to find. For example, the fresh fruits and vegetables would be close to the health foods supplements and diet control foods that weight-watchers commonly use. Coffee/tea/milk and biscuits/rusks make another possible grouping. You might think this is trivial, but department stores have recorded up to 20% increase in sales when such optimal grouping and placement was performed – again, through a form of analytics.
  • Bank loans and home loans are often approved with the credit scores of a customer. How is that calculated? An expert system of rules, classification, and extrapolation of existing patterns – you guessed it – using predictive analytics.
  • Allocating budgets in a company to maximize the total profit in the upcoming year is predictive analytics. This is simple at a startup, but imagine the situation in a company like Google, with thousands of departments and employees, all clamoring for funding. Predictive Analytics is the way to go in this case as well.
  • IoT (Internet of Things) smart devices are one of the most promising applications of predictive analytics. It will not be too long before the sensor data from aircraft parts use predictive analytics to tell its operators that it has a high likelihood of failure. Ditto for cars, refrigerators, military equipment, military infrastructure and aircraft, anything that uses IoT (which is nearly every embedded processing device available in the 21st century).
  • Fraud detection, malware detection, hacker intrusion detection, cryptocurrency hacking, and cryptocurrency theft are all ideal use cases for predictive analytics. In this case, the ML system detects anomalous behavior on an interface used by the hackers and cybercriminals to identify when a theft or a fraud is taking place, has taken place, or will take place in the future. Obviously, this is a dream come true for law enforcement agencies.

So now you know what predictive analytics is and what it can do. Now let’s come to the revolutionary new technology.

Meet Endor – The ‘Social Physics’ Phenomenon


Image result for endor image free to use

End-to-End Predictive Analytics Product – for non-tech users!


In a remarkable first, a research team at MIT, USA have created a new science called social physics, or sociophysics. Now, much about this field is deliberately kept highly confidential, because of its massive disruptive power as far as data science is concerned, especially predictive analytics. The only requirement of this science is that the system being modeled has to be a human-interaction based environment. To keep the discussion simple, we shall explain the entire system in points.

  • All systems in which human beings are involved follow scientific laws.
  • These laws have been identified, verified experimentally and derived scientifically.
  • Bylaws we mean equations, such as (just an example) Newton’s second law: F = m.a (Force equals mass times acceleration)
  • These equations establish laws of invariance – that are the same regardless of which human-interaction system is being modeled.
  • Hence the term social physics – like Maxwell’s laws of electromagnetism or Newton’s theory of gravitation, these laws are a new discovery that are universal as long as the agents interacting in the system are humans.
  • The invariance and universality of these laws have two important consequences:
    1. The need for large amounts of data disappears – Because of the laws, many of the predictive capacities of the model can be obtained with a minimal amount of data. Hence small companies now have the power to use analytics that was mostly used by the FAMGA (Facebook, Amazon, Microsoft, Google, Apple) set of companies since they were the only ones with the money to maintain Big Data warehouses and data lakes.
    2. There is no need for data cleaning. Since the model being used is canonical, it is independent of data problems like outliers, missing data, nonsense data, unavailable data, and data corruption. This is due to the orthogonality of the model ( a Knowledge Sphere) being constructed and the data available.
  • Performance is superior to deep learning, Google TensorFlow, Python, R, Julia, PyTorch, and scikit-learn. Consistently, the model has outscored the latter models in Kaggle competitions, without any data pre-processing or data preparation and cleansing!
  • Data being orthogonal to interpretation and manipulation means that encrypted data can be used as-is. There is no need to decrypt encrypted data to perform a data science task or experiment. This is significant because the independence of the model functioning even for encrypted data opens the door to blockchain technology and blockchain data to be used in standard data science tasks. Furthermore, this allows hashing techniques to be used to hide confidential data and perform the data mining task without any knowledge of what the data indicates.

Are You Serious?

Image result for OMG image

That’s a valid question given these claims! And that is why I recommend everyone who has the slightest or smallest interest in data science to visit and completely read and explore the following links:

  1. https://www.endor.com
  2. https://www.endor.com/white-paper
  3. http://socialphysics.media.mit.edu/
  4. https://en.wikipedia.org/wiki/Social_physics

Now when I say completely read, I mean completely read. Visit every section and read every bit of text that is available on the three sites above. You will soon understand why this is such a revolutionary idea.

  1. https://ssir.org/book_reviews/entry/going_with_the_idea_flow#
  2. https://www.datanami.com/2014/05/21/social-physics-harnesses-big-data-predict-human-behavior/

These links above are articles about the social physics book and about the science of sociophysics in general.

For more details, please visit the following articles on Medium. These further document Endor.coin, a cryptocurrency built around the idea of sharing data with the public and getting paid for using the system and usage of your data. Preferably, read all, if busy, at least read Article No, 1.

  1. https://medium.com/endor/ama-session-with-prof-alex-sandy-pentland
  2. https://medium.com/endor/endor-token-distribution
  3. https://medium.com/endor/https-medium-com-endor-paradigm-shift-ai-predictive-analytics
  4. https://medium.com/endor/unleash-the-power-of-your-data

Operation of the Endor System

Upon every data set, the first action performed by the Endor Analytics Platform is clustering, also popularly known as automatic classification. Endor constructs what is known as a Knowledge Sphere, a canonical representation of the data set which can be constructed even with 10% of the data volume needed for the same project when deep learning was used.

Creation of the Knowledge Sphere takes 1-4 hours for a billion records dataset (which is pretty standard these days).

Now an explanation of the mathematics behind social physics is beyond our scope, but I will include the change in the data science process when the Endor platform was compared to a deep learning system built to solve the same problem the traditional way (with a 6-figure salary expert data scientist).

An edited excerpt from https://www.endor.com/white-paper:

From Appendix A: Social Physics Explained, Section 3.1, pages 28-34 (some material not included):

Prediction Demonstration using the Endor System:

Data:
The data that was used in this example originated from a retail financial investment platform
and contained the entire investment transactions of members of an investment community.
The data was anonymized and made public for research purposes at MIT (the data can be
shared upon request).


Summary of the dataset:
– 7 days of data
– 3,719,023 rows
– 178,266 unique users


Automatic Clusters Extraction:
Upon first analysis of the data the Endor system detects and extracts “behavioral clusters” – groups of
users whose data dynamics violates the mathematical invariances of the Social Physics. These clusters
are based on all the columns of the data, but is limited only to the last 7 days – as this is the data that
was provided to the system as input.


Behavioural Clusters Summary

Number of clusters:268,218
Clusters sizes: 62 (Mean), 15 (Median), 52508 (Max), 5 (Min)
Clusters per user:164 (Mean), 118 (Median), 703 (Max), 2 (Min)
Users in clusters: 102,770 out of the 178,266 users
Records per user: 6 (Median), 33 (Mean): applies only to users in clusters


Prediction Queries
The following prediction queries were defined:
1. New users to become “whales”: users who joined in the last 2 weeks that will generate at least
$500 in commission in the next 90 days
2. Reducing activity : users who were active in the last week that will reduce activity by 50% in the
next 30 days (but will not churn, and will still continue trading)
3. Churn in “whales”: currently active “whales” (as defined by their activity during the last 90 days),
who were active in the past week, to become inactive for the next 30 days
4. Will trade in Apple share for the first time: users who had never invested in Apple share, and
would buy it for the first time in the coming 30 days


Knowledge Sphere Manifestation of Queries
It is again important to note that the definition of the search queries is completely orthogonal to the
extraction of behavioral clusters and the generation of the Knowledge Sphere, which was done
independently of the queries definition.

Therefore, it is interesting to analyze the manifestation of the queries in the clusters detected by the system: Do the clusters contain information that is relevant to the definition of the queries, despite the fact that:

1. The clusters were extracted in a fully automatic way, using no semantic information about the
data, and –

2. The queries were defined after the clusters were extracted, and did not affect this process.

This analysis is done by measuring the number of clusters that contain a very high concentration of
“samples”; In other words, by looking for clusters that contain “many more examples than statistically
expected”.

A high number of such clusters (provided that it is significantly higher than the amount
received when randomly sampling the same population) proves the ability of this process to extract
valuable relevant semantic insights in a fully automatic way.


Comparison to Google TensorFlow

In this section a comparison between prediction process of the Endor system and Google’s
TensorFlow is presented. It is important to note that TensorFlow, like any other Deep Learning library,
faces some difficulties when dealing with data similar to the one under discussion:

1. An extremely uneven distribution of the number of records per user requires some canonization
of the data, which in turn requires:

2. Some manual work, done by an individual who has at least some understanding of data
science.

3. Some understanding of the semantics of the data, that requires an investment of time, as
well as access to the owner or provider of the data

4. A single-class classification, using an extremely uneven distribution of positive vs. negative
samples, tends to lead to the overfitting of the results and require some non-trivial maneuvering.

This again necessitates the involvement of an expert in Deep Learning (unlike the Endor system
which can be used by Business, Product or Marketing experts, with no perquisites in Machine
Learning or Data Science).


Traditional Methods

An expert in Deep Learning spent 2 weeks crafting a solution that would be based
on TensorFlow and has sufficient expertise to be able to handle the data. The solution that was created
used the following auxiliary techniques:

1.Trimming the data sequence to 200 records per customer, and padding the streams for users
who have less than 200 records with neutral records.

2.Creating 200 training sets, each having 1,000 customers (50% known positive labels, 50%
unknown) and then using these training sets to train the model.

3.Using sequence classification (RNN with 128 LSTMs) with 2 output neurons (positive,
negative), with the overall result being the difference between the scores of the two.

Observations (all statistics available in the white paper – and it’s stunning)

1.Endor outperforms Tensor Flow in 3 out of 4 queries, and results in the same accuracy in the 4th
.
2.The superiority of Endor is increasingly evident as the task becomes “more difficult” – focusing on
the top-100 rather than the top-500.

3.There is a clear distinction between “less dynamic queries” (becoming a whale, churn, reduce
activity” – for which static signals should likely be easier to detect) than the “Who will trade in
Apple for the first time” query, which are (a) more dynamic, and (b) have a very low baseline, such
that for the latter, Endor is 10x times more accurate!

4.As previously mentioned – the Tensor Flow results illustrated here employ 2 weeks of manual
improvements done by a Deep Learning expert, whereas the Endor results are 100% automatic and the entire prediction process in Endor took 4 hours.

Clearly, the path going forward for predictive analytics and data science is Endor, Endor, and Endor again!

Predictions for the Future

Personally, one thing has me sold – the robustness of the Endor system to handle noise and missing data. Earlier, this was the biggest bane of the data scientist in most companies (when data engineers are not available). 90% of the time of a professional data scientist would go into data cleaning and data preprocessing since our ML models were acutely sensitive to noise. This is the first solution that has eliminated this ‘grunt’ level work from data science completely.

The second prediction: the Endor system works upon principles of human interaction dynamics. My intuition tells me that data collected at random has its own dynamical systems that appear clearly to experts in complexity theory. I am completely certain that just as this tool developed a prediction tool with human society dynamical laws, data collected in general has its own laws of invariance. And the first person to identify these laws and build another Endor-style platform on them will be at the top of the data science pyramid – the alpha unicorn.

Final prediction – democratizing data science means that now data scientists are not required to have six-figure salaries. The success of the Endor platform means that anyone can perform advanced data science without resorting to TensorFlow, Python, R, Anaconda, etc. This platform will completely disrupt the entire data science technological sector. The first people to master it and build upon it to formalize the rules of invariance in the case of general data dynamics will for sure make a killing.

It is an exciting time to be a data science researcher!

Data Science is a broad field and it would require quite a few things to learn to master all these skills.

Dimensionless has several resources to get started with.

Sourced from Dimensionless

By Pauline Brown.

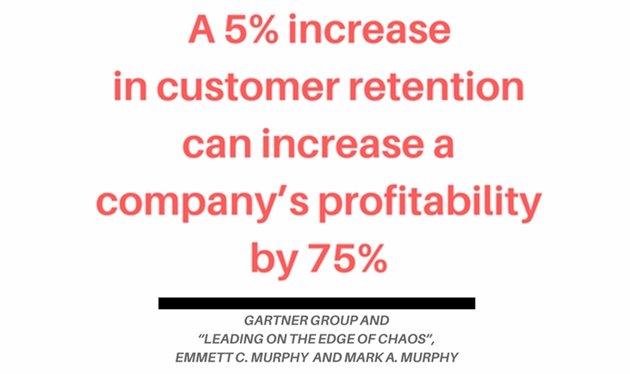
For most companies, the cost of acquiring a new customer is far more than the cost of retaining an existing customer—often 5-10 times more expensive.

Moreover, 61% of small business owners have reported that more than half of their annual revenue comes from repeat buyers.

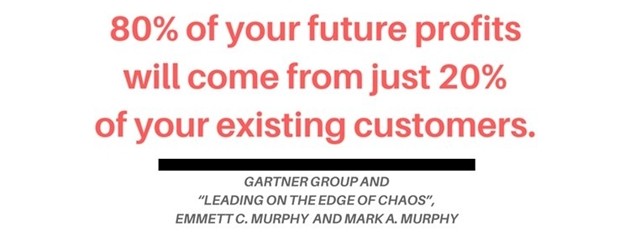
Those impressive numbers confirm the 80/20 rule to be true (20% of customers bring 80% of the business); and, thanks to the substantial amount of customer data businesses now have available, many businesses are shifting their primary focus to these customers.

If a business is to retain current customers, then its marketers must truly understand repeat customers’ needs to improve their overall experience with the brand and gain their long-term loyalty.

For most marketers, it is no longer a challenge to collect customer data: Analytical technologies have given us the tools to understand a customer’s actions at every point of interaction with a brand. But many marketers are still struggling to transform that analytical data into relevant information that can help improve customer loyalty.

Fortunately, there are steps marketers can take to harness data and keep churn rates at a minimum.

Companies have been using data science as a secret weapon to generate quickly actionable information that improves customer retention. If you’re interested in significantly decreasing your customer churn rate, here’s how to use the power of data science to define a process that will help your brand keep the customers you’ve already worked so hard to obtain.

Step 1: To identify churners, define your business model

Nowadays, subscription and recurring-revenue business models are everywhere. And no wonder: how customers want to access and pay for goods and services is changing, so companies are in turn changing their pricing models.

The first step in setting up a data-driven approach to increasing customer loyalty is to define the model used by your organization. More than likely, your model will fall under one of two varieties: a subscription model or a non-subscription model. (Netflix and Spotify are examples of a subscription model; Uber and eBay are examples of a non-subscription model.)

Your business model has an impact on the difficulty of determining “churn rate,” which can have different definitions; however, for most businesses, it’s a matter of whether a customer will become a “churner”—i.e., no longer a customer. Churn could also refer to the loss of contracts, MRR (monthly recurring revenue), contract value, and bookings.

Churn is frequently expressed as a rate, a ratio, or a whole number: for example, “We have a churn rate of 10%,” and, “We churned five customers.”

Identifying churners is straightforward in a subscription model: A customer churns when she requests a cancellation of her subscription. In a non-subscription model, however, you will need to analyze a customer’s behavioral tendencies to identify possible churn—such as the amount of time since he or she last used your company’s services. The primary goal is to determine the specific point after which your customer will no longer use your product or service.

Step 2: Decide on an approach to retain potential churners

Now that you’ve determined your business model, there are many ways you can start retaining potential churners with both short-term actions and a long-term approach. To have the most effective and sustainable impact on customer loyalty, you can try a combination of the following two methods.

1. One-shot, short-term actions to reduce churn

  • Launch special offers in the form of calls, push notifications, free in-game money, discount coupons, etc.
  • To control or measure customer satisfaction, set up customer feedback loops in the form of surveys, on-website or in-app questionnaires, self-service options such as designated review or feedback sections.

2. Longer-term approaches to attack the root of a problem to reduce churn

  • Reduce obstacles to make it easier to purchase your product.
  • Analyze whether your the offer fits your customer base.

Step 3: Create customer profiles (segments) and determine their behavior

What do you need to provide the right offer to your customers at the right moment (i.e., when they are making a purchasing decision)?

The answer: in-depth knowledge about that customer. However, too often customers avoid handing over personal information that can be useful to marketers—such as age, gender, profession, and buying habits. That’s why a data-driven approach is an advantage.

Instead of asking customers for such information, it can be collected and assessed externally. The success of your business is directly linked to a true understanding of your customers, and a data science approach works only when you have a defined target. In a subscription business model, the target is known; however, if you’re operating a non-subscription model, you will first need to define your target if you’re going to understand it.

You can create a customer profile and identify behaviors by asking yourself (or your team) the following questions:

  • Which customers do we care about? Segment your customers based on their behavior, and ask, “Which customers do we care most about?” Regardless of the answer, the only way to increase customer loyalty with this type of campaign is to target a well-defined customer segment.
  • How will we segment new customers? By understanding the extremes of your customers, you can create and refine new customer segments. On one extreme, you will have customers who interacted with your brand at least once, but discontinued interaction afterward. The other extreme will include customers who use your product or service frequently or are heavily engaged with your brand.Once you identify these extremes and understand your customer segmentations, it will be much easier to place a new customer in the appropriate grouping.
  • What makes our churner customers different? You will begin identifying patterns among your churners and define what makes them different fomr others. Make note of, and discuss, these differences frequently.

Step 4: Define and implement a customer-scoring process

Now that you’ve identified your target customers and understand their behaviors, you can implement a method of scoring your customers based on the data you have about them.

Customer traits, such as social information and behavior-based actions, can be used to paint a picture of who they are. Then, you can compute a score that incorporates all relevant customer features to determine exactly how likely that person is to abandon your offerings.

This is the point at which you can harness data science to take over. A predictive analytics platform can be used to aggregate all your customer data, identify potential churners, and calculate a score that predicts the potential loyalty of your customers.

This type of scoring system enables marketers to creatively segment customers and activate the most appropriate marketing strategies for each. For example, potential customer segments and actions for each could be laid out like this:

  • Loyal customers: Take no action.
  • Potential churners (customers you want to keep): Send a special offer via email.
  • Churners: Send a special offer via email.
  • Ambivalent (unsure whether to keep): Send a simple greeting without an offer.

When debating whether to spend money to attract new customers or to take care of the customers you already have, the answer is usually simple: The costs of acquiring a new customer far outweigh the costs of keeping one you already have.

Using the steps outlined above, you can arm your marketing team with the necessary data and customer insights that will help your company not only identify and retain potential churners but also improve the customer experience overall.

By Pauline Brown

Sourced from MarketingProfs