Tag

Google Analytics

Browsing

Sourced from usergrowth

What is the first thing that comes to your mind when you hear about Google Analytics?

For most people it has probably something to do with Search Engine Optimisation (SEO), but did you know that next to that Google Analytics (GA) also holds tons of insights into how you can create better content for your business?

To save time and money for your company don’t you think it would be better if you could create better content, instead of more content?

Better content that could help you rank better for the search terms that you want to be found for? Instead of just trying to create as much content as possible hoping you eventually will rank?

There are, however, dozens of different ways to slice and dice all the information that is available in Google Analytics to come up with killer content ideas.

To help you get the most out of your valuable time and to help guide you to improve your content marketing, this post will help you set up your Google Analytics, teaches you the most common terminology you need to navigate through all the reports and help get the most out of your content marketing.

First, let’s figure out why you should be taking the time to learn and use Google Analytics for your Content Marketing.

Why is Google Analytics important for content marketing?

If You Can’t Measure It, You Can’t Improve It. – Peter Drucker  Click To Tweet

Management thinker Peter Drucker was right, for you to improve any parts of your business, you need to be able to measure it. And what easier way to measure using a tool that offers incredible reporting features at no cost, from a company that is already collecting vast amounts of data from your company and your customers.

By reading the numbers, Google Analytics can capture about your business and try to figure out the story they are trying to tell you is THE best way to not just make data-informed marketing decisions, but to also improve your marketing performance in general.

Let’s say for example you’ve got an idea for a piece of content. You assume that this is the kind of material your customers are waiting for after all content marketing is just solving the same problems that your product solves through media you create and promote, right?

So you do some research online, you start creating what you think is the absolute best piece of content around the subject you’ve ever seen, and you hit that publish button.

If you’re not having any forms of analytics, your story will end just there. Your piece of content is online, and you’re hoping for the best. Maybe you would see new leads coming in, but that’s it.

By using analytics (and Google Analytics is one of the best, easy and free tools available), you would not only know if that piece of content is hitting the marks, but you can also figure out the rest of the story.

What are all the individual pieces that led up to that conversion, to the people coming to your site?

It doesn’t only help you to establish your goals. It can help you to learn how to repeat the process in the most efficient ways, coming up with new content topics, maybe learning how you need to make adjustments to your content, so it does hit the mark etc.

And not only that, Google Analytics can help you answer questions like:

  • How effective are my Content Marketing efforts?
  • What are the pieces of content that are the least effective and turn visitors away?
  • Are my efforts improving over time?
  • Which types of content are most effective for converting visitors? Which types of content are most effective to build traffic?
  • What are some content topics that I’m missing out on?
  • What are some quick wins that I can implement?

You see, the better data you have the more informed decisions you can make about your content marketing strategy and how to move forward.

Implementing Google Analytics on your site

Now that you know the importance of measuring your Content Marketing efforts using Google Analytics let’s dive into the basics to help you get started.

Creating a Google Analytics account

First things first, before you can use Google Analytics you have to set up Google Analytics on your website of course.

If you don’t already have a Google Analytics account, you can quickly create one for free on the Google Analytics website!

To create a Google Analytics account:

  1. Click here to go to Google Analytics. Note: If you have a Google account, and are not signed in, click Sign in. If you do not have a Google account, click Create an account.
  2. Once you have signed in to your Google account, click Access Google Analytics.
  3. Click Sign up.
  4. Fill in your Account Name, Website Name, Website URL, and select an Industry Category and Reporting Time Zone.
  5. Under Data Sharing Options, check the boxes next to the options that you want.
  6. Click Get Tracking ID.
  7. From the Google Analytics Terms of Service Agreement that opens, click I Accept.
  8. Write down the Tracking ID for setup on your website.

Installing Google Analytics using Google Tag Manager

The next thing you have to do is set up Google Analytics on your website. If you’re running WordPress like us, there are three different ways to do this:

  1. Implement the Tracking ID manually in your WordPress theme (only if you know how to code, ask your developer otherwise)
  2. Use a plugin like Monster Insights to add the basic tracking functionality to your website quickly
  3. Take a little longer approach by using Google Tag Manager to implement the tracking ID.

Our preference goes to the last method.

Google Tag manager not only allows you to implement Google Analytics on your website, but it also gives an easy way to deploy and manage all other marketing tags (snippets of code or tracking pixel, think Facebook Pixel, Snapchat pixel, etc.) to your website without you needing a developer at all.

So head over to Google Tag Manager and signup. Next step is creating a new account by entering an account name and location. Followed by entering the name of your website as the container name and choosing web as the place to use the container.

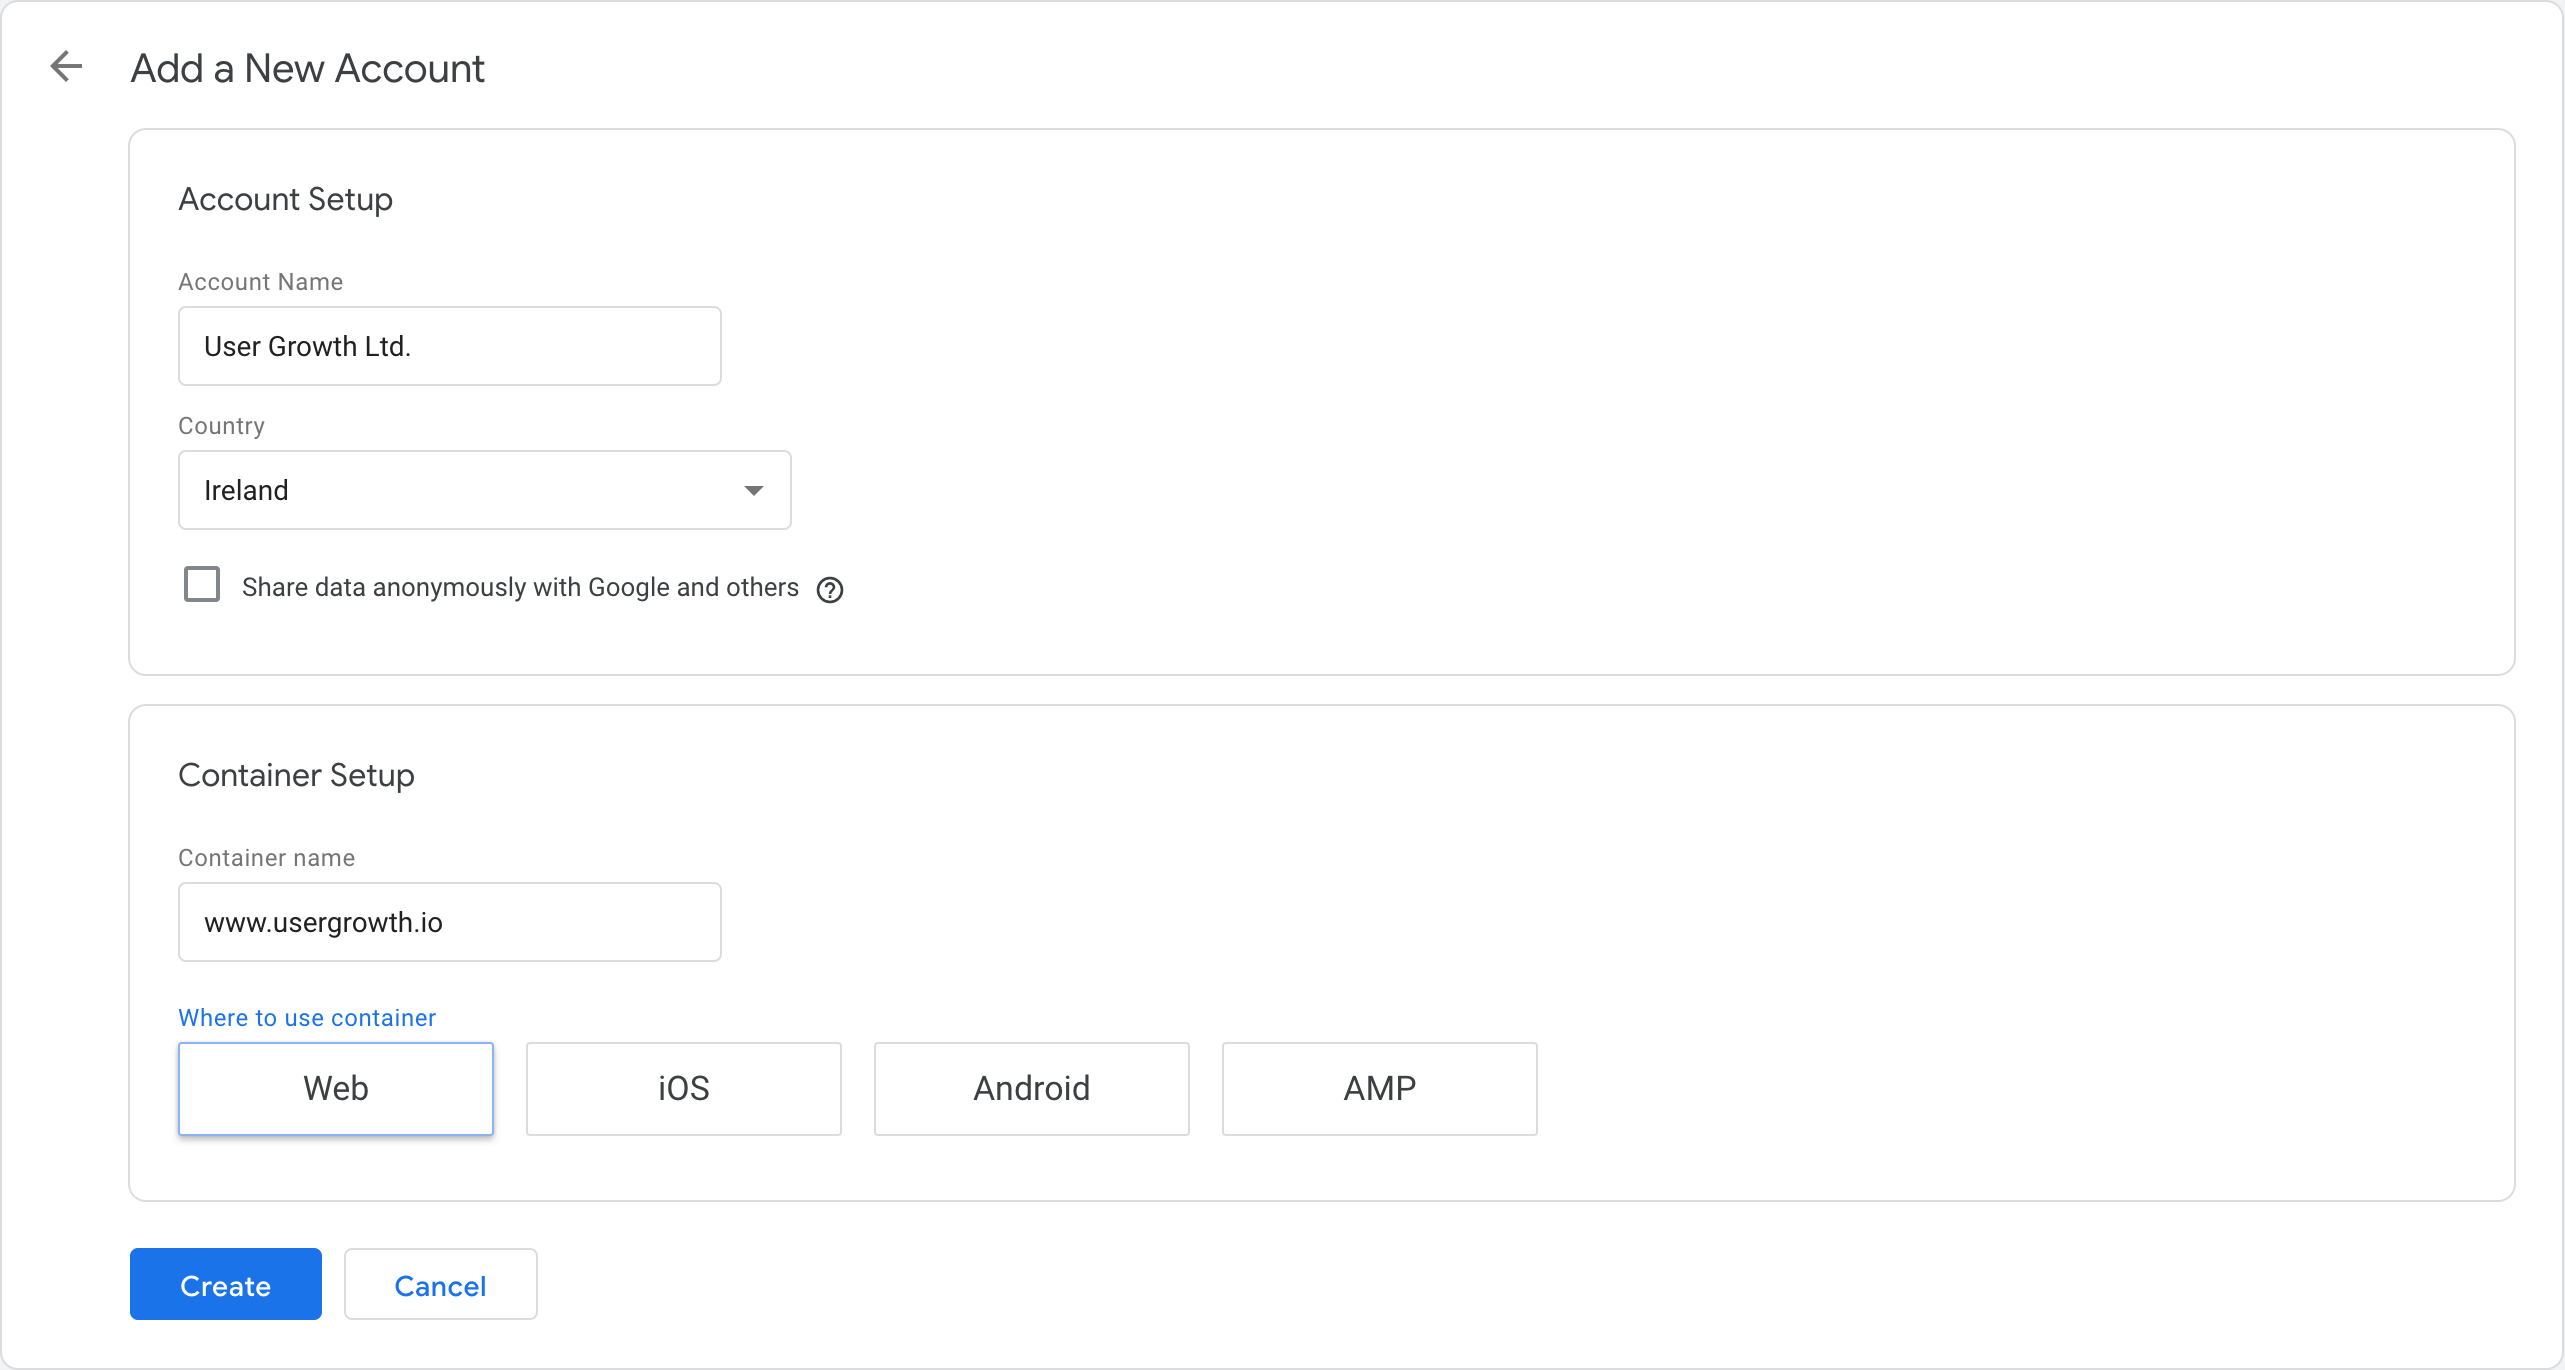
Pretty straightforward right?

Now accept the Terms of Services of Google Tag Manager, and you’re almost good to go.

Copy the tracking snippet given to you and then most importantly the Google Tag Manager ID (looks like GTM-XXXXXXX).

Using the Google Tag Manager for WordPress plugin, you don’t need to edit any code. Just install the plugin and copy paste the Google Tag Manager ID after activating the plugin and going to the settings.

Now we need to add a tag into the Google Tag Manager, do this by pressing the “New Tag” button.

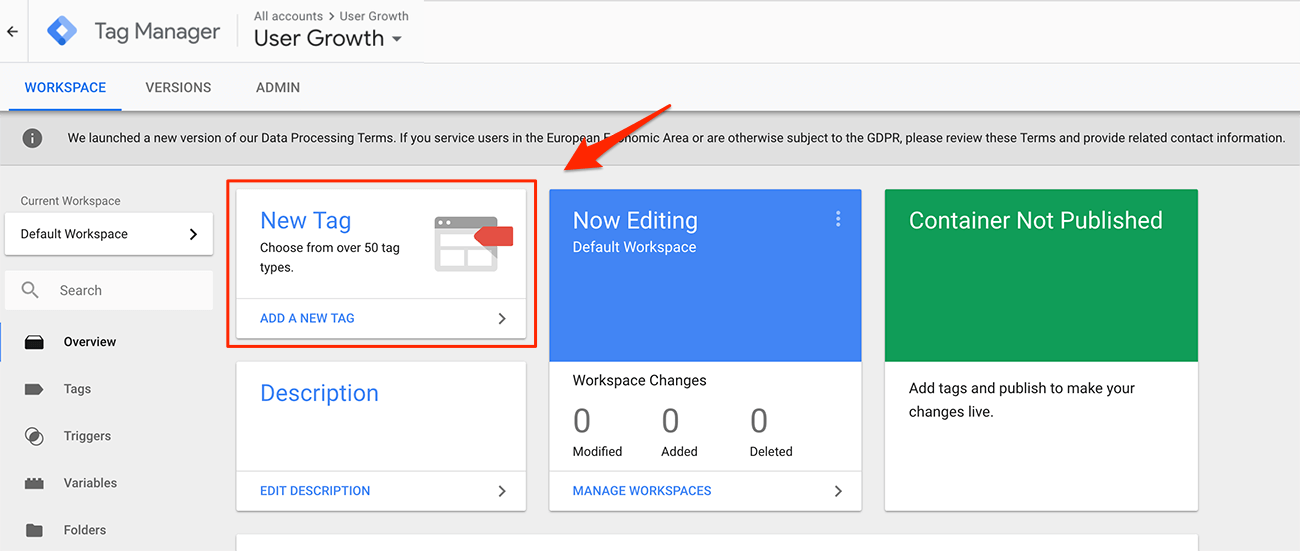
Then you need to come up with a name, so the tag is easily recognisable for future use. We suggest using “Google Analytics”, but feel free to use whatever you want.

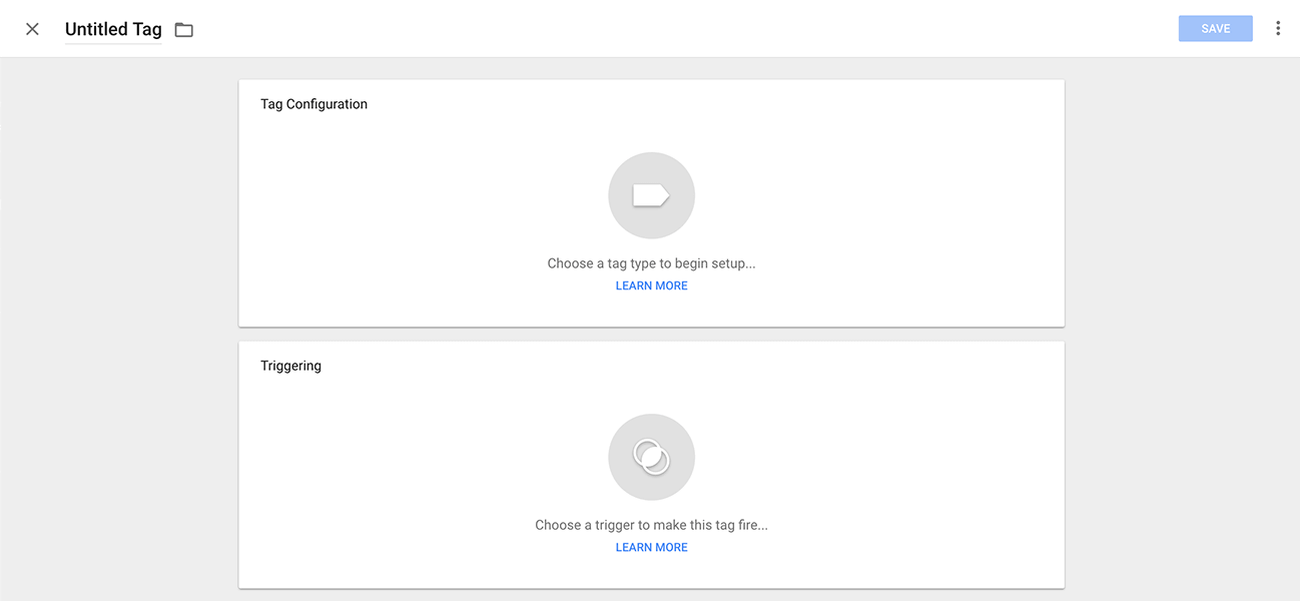
Next step, click on the big button in the “Tag Configuration” to begin the setup. There are a lot of different tags to choose from, but the first one is for “Universal Analytics”, that is the one we want.

To not go into too many details right now, you will keep the “Tracking Type” set for “Pageview”, and then you choose “New Variable…” in the Google Analytics settings.

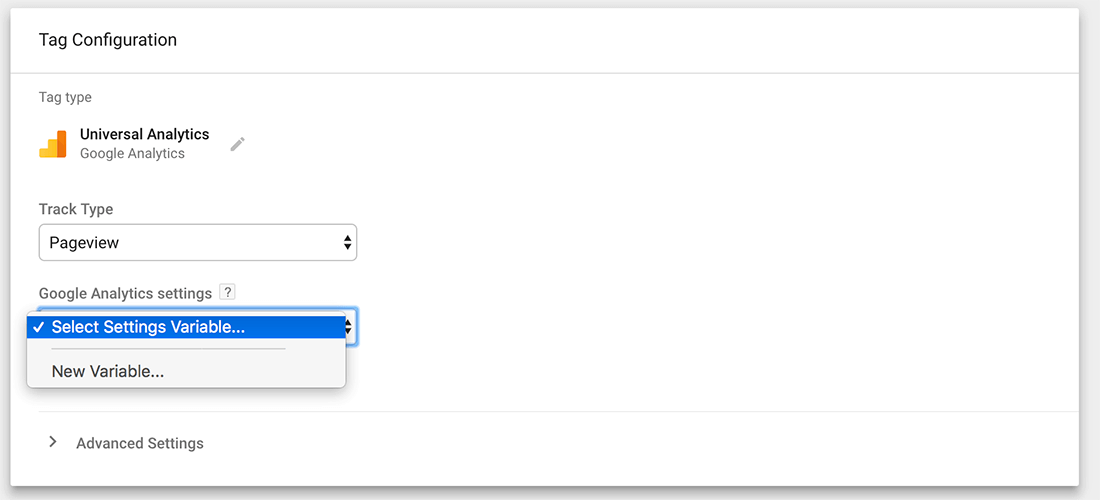
In the next screen, you can then enter your Tracking ID from the Google Analytics you set up earlier. Google Tag Manager asks you to name the variable for later use in other places, let’s keep that name as it is.

Next, you can click on the “Choose a trigger to make this tag fire…” button. For a basic Google Analytics implementation select “All Pages”.

The final step now to have Google Analytics working on your website and have it execute on every page is hitting the Submit Button (top right corner):

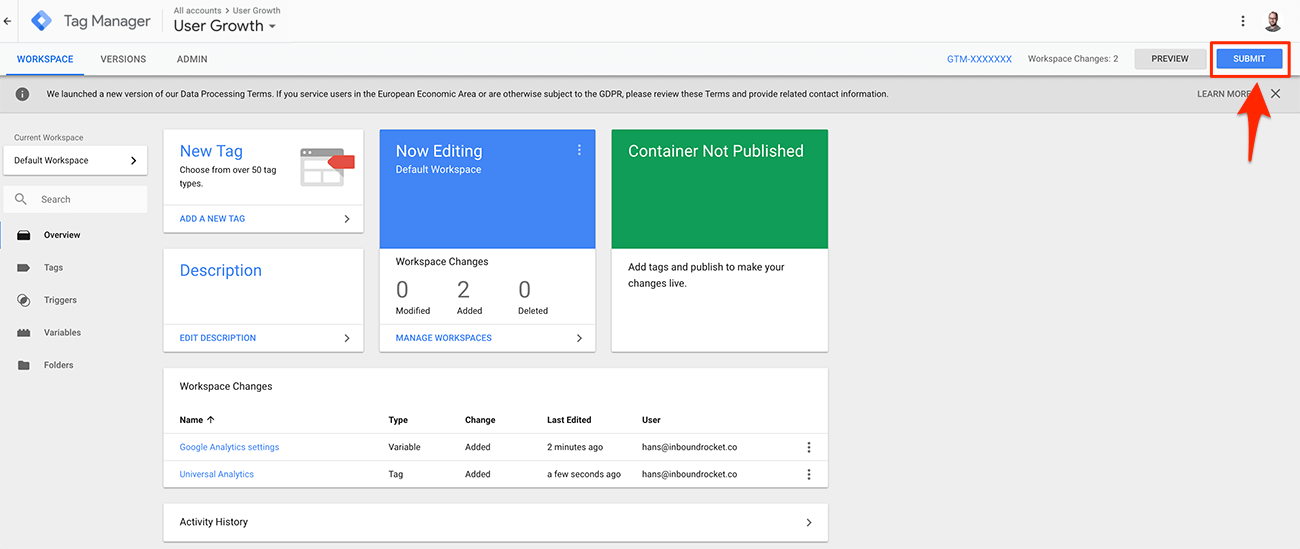
Giving your changes a version name and hit publish. When Google Tag Manager for WordPress is activated with your Google Tag Manager ID, Google Analytics will now be working on your site.

Google Analytics Terminology

Before we go any deeper, let’s first get the fundamental terminology right, this way you can better understand any reporting that Google Analytics throws at you.

What is a User within Google Analytics?

One of the first things you need to know about Google Analytics is what is considered a “user” within GA. For GA an individual that browses your website is called a user. (If you want to get real technical it is a unique browser cookie). It does not matter if a person visits your website only once, or multiple times. For example, one user can create five sessions on your site, and each session has numerous page views.

Since GA uses a unique cookie to identify this person, it means a user is stored to a browser. When someone visits your website using different browsers (on the same machine or different devices), GA will report more than one user.

If you want to identify one person over multiple devices/browsers, you need to use the User ID feature. A User ID is a way to combine sessions from a known person on your website. If you have a way to identify someone (by using an ID from your CRM system for example), you can send that ID to GA, which enables a unique set of cross-device reports. Of course, this works only accurately when you can identify a visitor’s (for example when someone is logged into your website) and won’t work for all visitors.

What are Pageviews?

A Pageview is precisely what you think it would mean, when a User views a page on your website, this will be reported as a Pageview. By default, Google Analytics orders your pages based on the most amounts of views. This helps you to identify which content of yours is viewed more than others.

What are Unique Pageviews?

The problem with Pageviews though is that if a User visits the same page multiple times within the same session, they are all counted as Pageviews. This means that when someone goes back to a previous page after consuming a particular piece of content that the original page is recorded twice as being viewed. Even if the only reason to go back was that they knew there was another link on there that they wanted to explore.

By looking at Unique Pageviews, every page is only counted once within a single session, even if it was viewed multiple times.

How are Pageviews combined into Sessions?

While Pageviews are interesting, it is always interesting to figure out how many Sessions there were on your website. When someone starts on an individual article on your blog, then moves on to the “Homepage” and afterwards to your “About Us” page to find out more information about your company, those three pages are combined into what is called a Session on your website.

So how does this compare to a User and Pageviews? When a person returns a couple of days later and visits five more pages, five more pageviews are recorded in your reporting, there is still only one User, and there are now two Sessions for that User.

What is Bounce Rate?

The Bounce Rate is another very interesting reporting that is important to know about. A Bounce Rate is the percentage of sessions that have only one single Pageview. The Bounce Rate can give you a quick overview of how your content is performing and which content or which pages deserve extra attention. After all, you want your visitors to get down the rabbit hole, consuming more and more content, so they start to see the value of your company and turn into leads.

Don’t forget to put the Bounce Rate into the context of the type of page the Bounce Rate is reporting on. For example, landing pages should have a lower Bounce Rate (because you want people to convert and move to the Thank You page), then maybe your Homepage or a Store Locator.

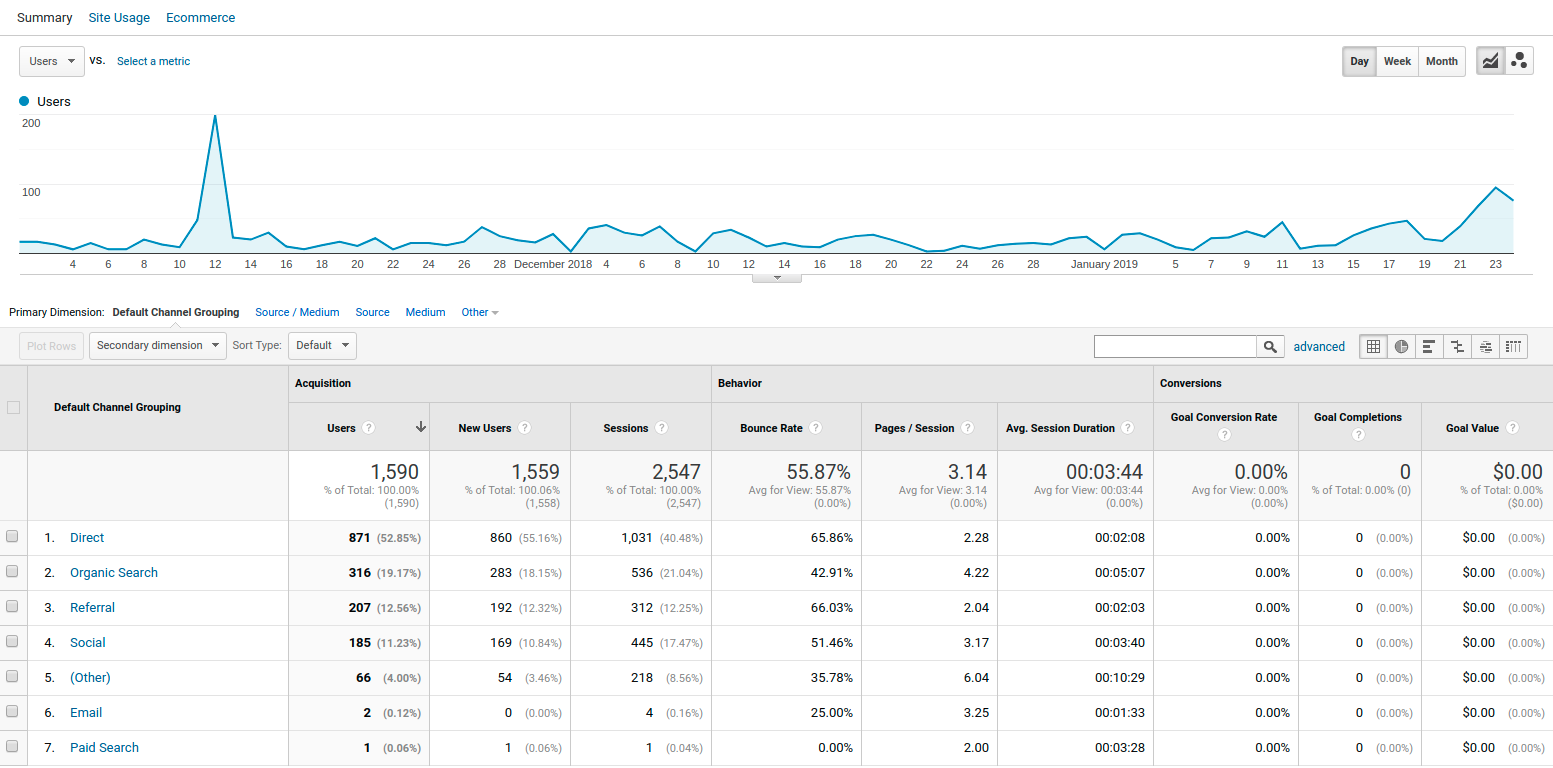
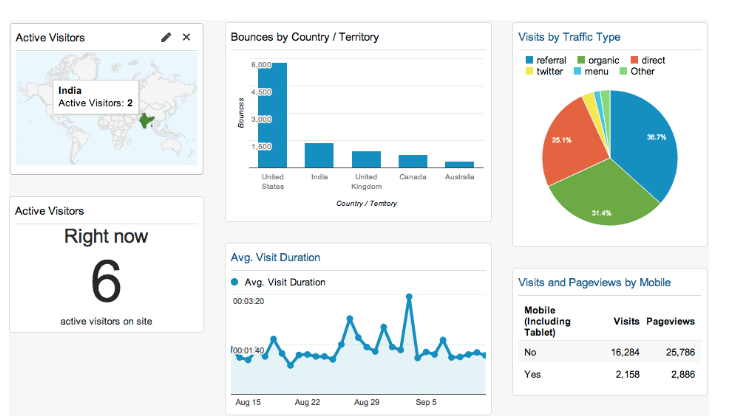
What is the Acquisition Report in Google Analytics

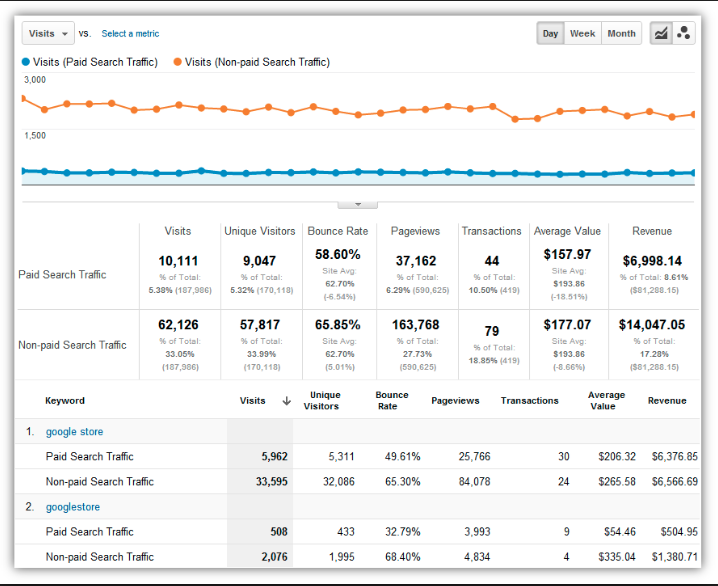
If you want to figure out how people are finding your website, you will be looking at the Acquisition reports. The Acquisition Report shows you where your visitors are coming from and gives you a report that shows the source, medium and other acquisition dimensions. You can also see traffic from social networks as well as traffic from custom campaign tags.

When you link your Google Search Console, and your Google AdWords accounts to your Google Analytics account you can also get dedicated reports around paid traffic and organic traffic.

What is a Referral in Google Analytics

A bit in the same line as the Acquisition Reports are the Referral reports. When someone arrives at your website from another third-party webpage, this will be reported as a Referral. In other words, all the sites that are sending you traffic (by domain) are listed here. If you want you can drill it down to view the “Referral Path”, which gives you an overview of all the individual pages linking to your website.

What are UTM Tags

One of the essential ways you need to start tracking all your Inbound Marketing activity (all the campaigns that you’re doing on other places on the internet that will give traffic back to your website) is by using UTM tags.

You can add extra details at the end of a link your sharing (query parameters), and these additional details will then be included in your Acquisition Reports.

UTM stands for “Urchin Tracking Module” (the company that invented them and got bought by Google, turning into Google Analytics) and they are the things you can see after a URL in your browser. These extra details are always at the end of a URL you’re sharing and include things like “utm_campaign”, “utm_source”, “utm_medium”, “utm_term”, “utm_content” and “utm_id”.

Campaign Name

The “utm_campaign” is one of the three main dimensions that make up a UTM tag (the others being utm_source and utm_medium). This helps you to identify a specific product promotion or strategic campaign. For example: utm_campaign=spring_sale

Source

“utm_source” is the second one that is important for tagging your URL’s correctly. Source helps you to analyse how people found your website, and it tells you where the campaign is coming from. It can help for example to identify if someone clicks on a link in a newsletter “utm_source=newsletter”, search engine “utm_source=google” or any other place that you’re running a campaign. Combined with the next one “medium”, you can get even more granular insights.

Medium

The last one you need is “utm_medium”. Medium can tell you how the message was communicated to the visitor. For example “utm_medium=cpc” for a cost-per-click campaign, or “utm_medium=affiliate” for an affiliate link.

Term

The “utm_term” and “utm_content” parameters are not mandatory but if used can give you a little bit more extra insights. For example, the “utm_term” parameter is used for tracking your keywords during a paid AdWords campaign. You can also use it in your display ad campaigns to identify aspects of your audience. For example “utm_term=running+shoes”

Content

“utm_content” finally is being used when you’re running A/B tests on your ads. It is a useful metric that can pass details about the version people clicked on and as a result, can help you which version is more effective than the other. For example “utm_content=logolink” or “utm_content=textlink”

Turning Google Analytics into valuable, actionable information

Being able to collect all of this data is great, but at one point it can become a bit overwhelming.

Do you know exactly what to look for when you read analytics data? Let’s have a look into how we can get the most out of the data and turn it into valuable, actionable information.

Setting up goals for important conversions on your site.

When setting up Google Analytics for the first time, it is more than just adding the tracker on your website.

If you want to get the most out of your installation, you need to start setting up goals. Goals allow you to see how many visitors are taking action, converting into leads, subscribers and customers. You can see what sources of traffic are sending visitors that are most likely to convert, and which pages are the most convincing.

So what are Goals exactly? According to Google:

Goals measure how well your site or app fulfills your target objectives. A goal represents a completed activity, called a conversion, that contributes to the success of your business. Examples of goals include making a purchase (for an ecommerce site), completing a game level (for a mobile gaming app), or submitting a contact information form (for a marketing or lead generation site).

Defining goals is a fundamental component of any digital analytics measurement plan. Having properly configured goals allows Analytics to provide you with critical information, such as the number of conversions and the conversion rate for your site or app. Without this information, it’s almost impossible to evaluate the effectiveness of your online business and marketing campaigns.

In other words, goals measure how and when people complete specific actions that you want them to complete.

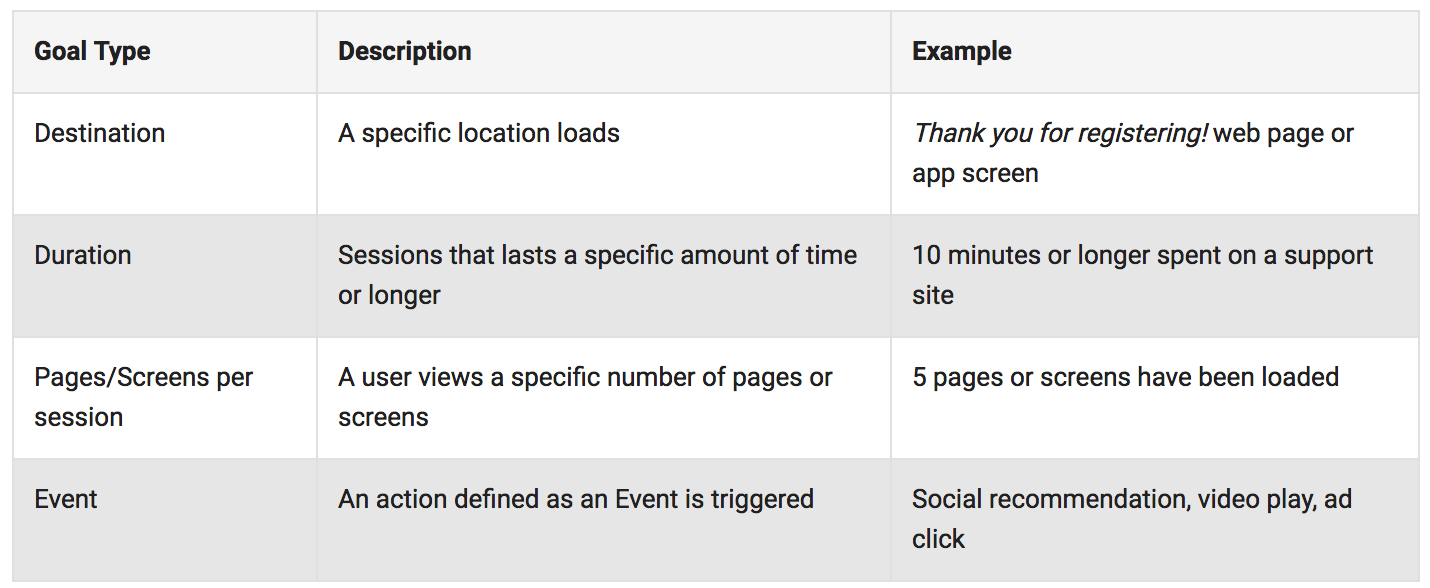
There are four different types of goals you can use to track your content marketing results:

Setting up goals requires that your first figure out, what is essential for your business? What goal do you want your visitors to achieve on your site?

Here are a few ideas that might get you started:

  • Email list sign-ups
  • Webinar registrations
  • White paper downloads
  • Contact form completions
  • Views of a specific page

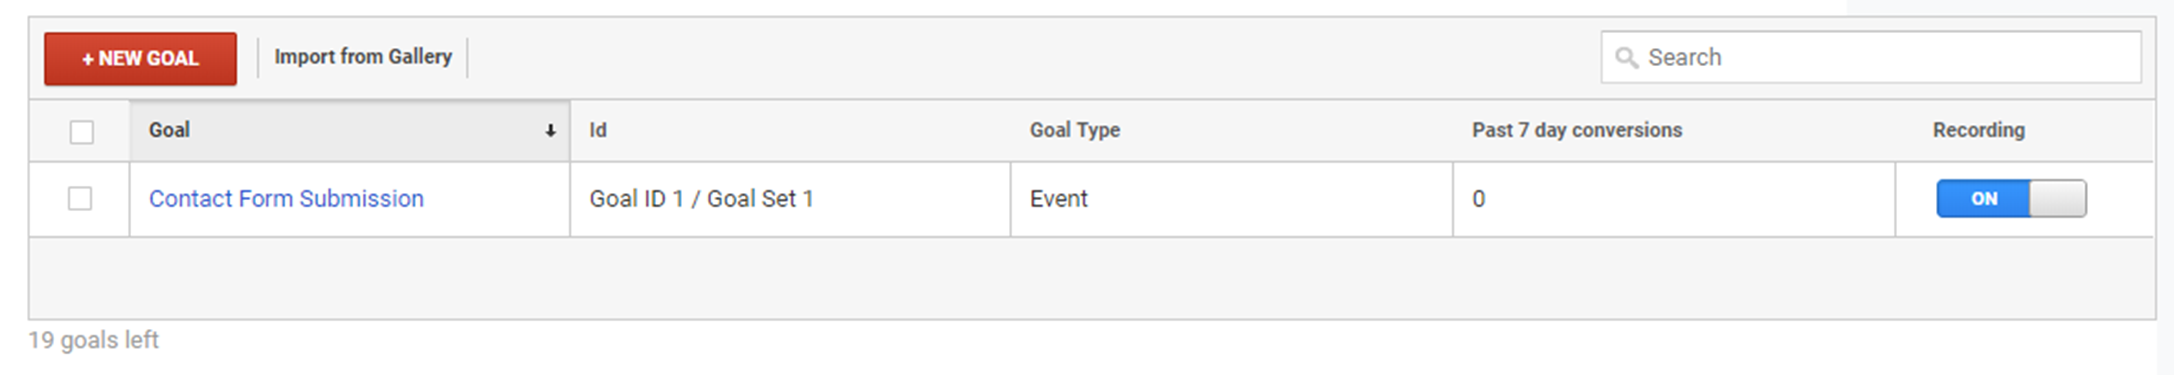
Don’t go too crazy though, Google only limits you to 20 per account, and that is for a good reason.

Every goal that you’re adding will add an extra column in a lot of reports. And to much data will make you lose sight of your main objectives. Start off with one or two, and slowly add more over time when you think they are needed.

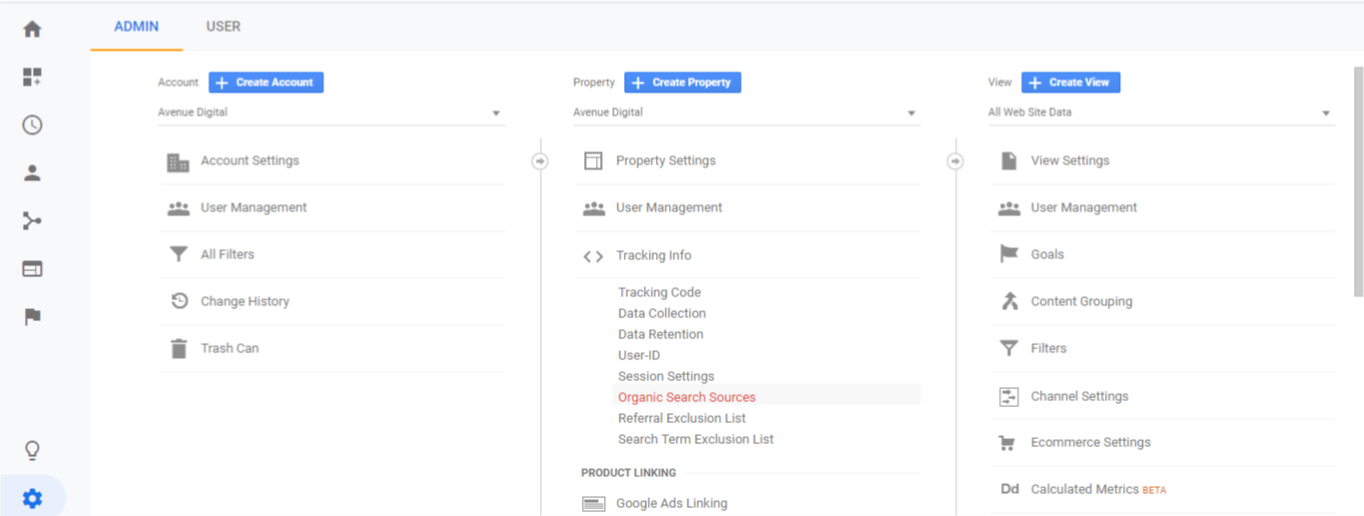
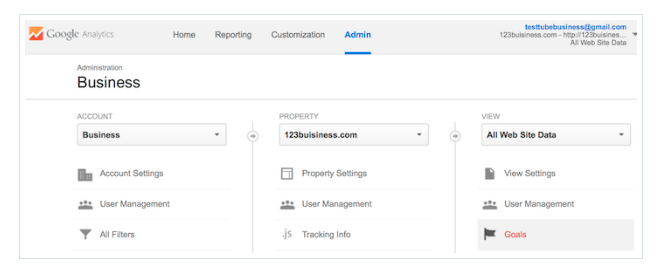
To create a new goal, click on “Admin” in the left panel, then in the “View” column, click on Goals. Simply press the “+New Goal button“, and you’re off.

Most of your goals you want your visitors to end up on a specific destination, after all when someone converts they end up on a Thank You page and that is considered a conversion.

Creating redirects to pages like this can quickly be done within Inbound Rocket, by setting up the form type to post and going to a specific page after.

The slug of this page is the destination you need to enter as the Destination URL in your goal, and you’re all good to go.

If needed, you can create a monetary value to the conversion. For example, if you’re setting up the goal for tracking e-commerce transactions, you can specify the goal value to measure the revenue each transaction generates.

Aligning your goals across the Buyers Journey to what you can track

Understanding your customers, Buyers Journey is crucial if you want to develop strategic marketing tactics that are working. Thankfully Google Analytics offers many powerful functions to measure customer behaviour, allowing you to learn from this and respond accordingly.

The moment you start to understand how your customers are behaving and what they are looking for, you can develop the content to meet their needs at every stage of the journey.

So now that you know how to set up goals, let’s start aligning your goals with the different phases of the Buyers Journey, so you can track your entire conversion funnel.

Topics and reports to think about here are:

Awareness

  • Traffic by Channel/Medium
  • Traffic by Content Grouping
  • Traffic by Author, Topic, Word Count, Date Published

Engagement

  • Content Downloads
  • Watched Video
  • Newsletter Signups
  • Email marketing traffic
  • Retargeting Trafic

Conversion

  • Lead & Contact Forms
  • eCommerce Transaction
  • Average Order Value
  • App Downloads
  • Software Trials
  • Conversions by Content Type

Retention

  • Repeat Revenue
  • Content consumption by logged in Users
  • Product Reviews

By using the reports, Google Analytics has combined with custom Goals you can understand your potential customers or leads better and more effectively, steer them in the direction of a satisfied customer and keep them there.

Using Site Search

One of the easiest way to help your visitors on your site and to keep them on your site is by offering a search bar.

There can also be a time when your site is somehow not optimised enough, and they can’t find what they are looking for; a search bar can help them stay on your site. On top of that, it can also provide valuable insights for you.

Google Analytics can help you tap into this data through its on-site search terms report. By using this report, you can quickly review which keywords people are searching for on your site. It might be that you were targeting the complete wrong keywords and your visitors are using different keywords to describe their problems. By comparing what you were initially thinking to the search terms, they are using you can identify if you’re on the right track.

Or maybe there is a missed opportunity for some new pieces of content you can work on? After all, you know exactly what your customers are searching for, so it can identify additional content you can create that drives more traffic and builds more engagement.

When setting up correctly you can use the information to:

  • target the search result pages with specific campaigns (especially if they are converting well)
  • create better internal links so that the high-traffic pages allow to deliver more traffic to lesser performing pages
  • restructure your website to make specific content more accessible to find
  • identify topics and keywords you can use in content creation

Setting this up correctly is quite easy in Google Analytics. Like setting up goals, click on Admin in the left panel, click View Settings and then enable Site search Tracking:

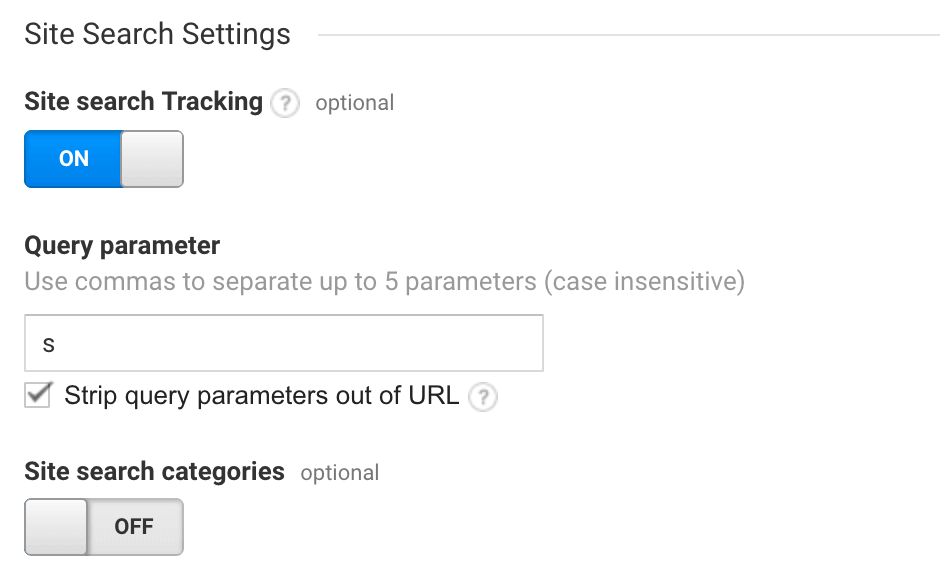
Then, just below the slider, you’ll see a field to enter a Query parameter. The “query parameter” is the letter that appears in the URL to identify a search is happening. (Like the UTM tags). If you’re running WordPress, the default value is “?s=“ so the letter s is what you need to put as the query parameter. Try testing it on your website to see how the URL looks when you search for something.

The last step to do is checking the box “Strip query parameter out of URL” If you don’t select this option than Google Analytics will start to split up the same searches from different pages. For example, you will begin to see separate listings for mycomany.com/searchresultpage?s=1 and mycompany.com/searchresultpage?s=2.

When you tell GA to “strip query parameters out of URL” it will just track all those visits together as mycompany.com/searchresultpage, while still being able to see the internal searches when viewing your site search data.

After you hit save, you can start seeing the results coming in for your site in Google Analytics under “Behaviour” > “Site Search” > “Search Terms”. If no results are produced while searching on your site, those terms will be shown as no-results: keyword.

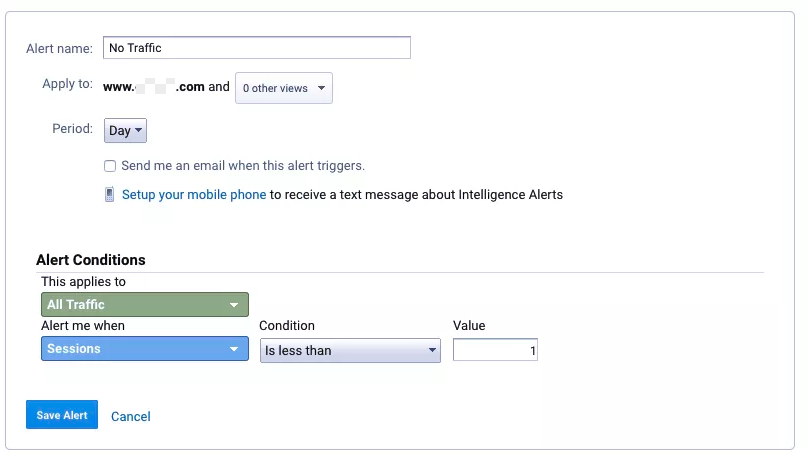
Identifying and Filtering Internal Traffic from Google Analytics

Depending on the size of your business, employees browsing your website can cause some severe issues in your Google Analytics reporting. People at your company don’t act like a typical visitor on your site, and as a result alter the metrics that are reported most of the times, like users, sessions and Pageviews.

On top of that, they affect probably the most important metrics for your organisation, the conversion rate and attribution reporting in your goals. These can directly impact budgeting, bid strategies for ads and all sorts of other business decisions.

The best thing for you to do is create a filtered view within Google Analytics so that these internal visits are not messing up your data.

The easiest way to do this is to create an IP address filter in GA. But before you can do that, you first need to figure out what your IP address is, just head over to https://www.whatismyip.com/ or do a Google search for “what is my IP address.”

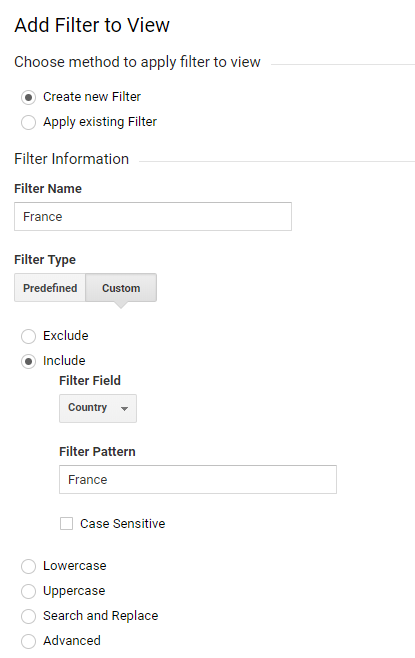
Now we go to our Google Analytics, choose Admin in the left column and then from the Account column select All Filters, Then, click +Add Filter.

You can give your Filter a name like “Internal Traffic Filter”. You can leave the Filter Type as predefined, select Exclude from the Select filter type drop-down. In Select source or destination, “select traffic from the IP addresses” and finally chose “that are equal to”.

In the input box below you can then enter the IP Address you found earlier, and then the only thing left to do is to “Apply Filter to Views” section, where you select “All Website Data” and then click the Add button. Hit save, and you’re good to go.

From now on all visitors internal within your company are complete ignored.

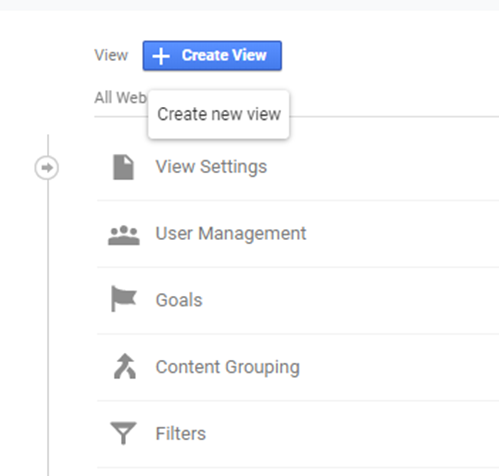
If you still want to be able to make sure that the original data is still saved, the best thing to do before setting up a filter is to create a new view just for this filter. This way you will have the raw data and filtered data available for you. To do that,

  1. Click “Admin“, and navigate to the account and property to which you want to add the view.
  2. In the VIEW column, click the menu, then click “Create new view“.
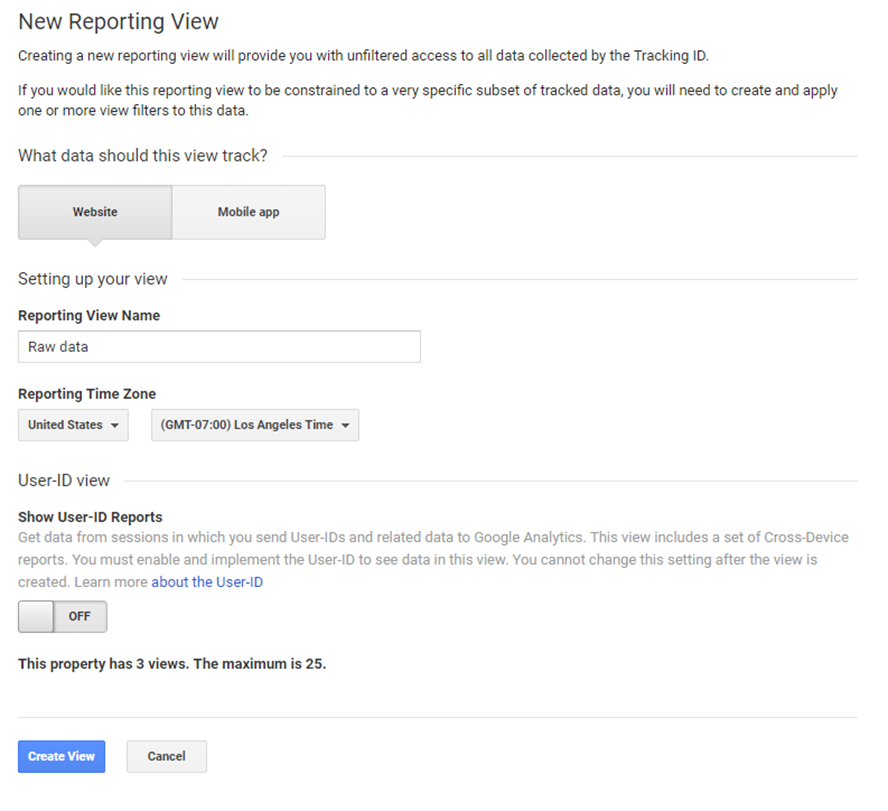
  3. Select either Web Site or App.
  4. Enter a Name (like filtered view). (Use a specific and descriptive name, so you can easily tell what data is in this view when you see the name in a list.)
  5. Select the Reporting Time Zone. (If your Analytics account is linked to a Google AdWords account, the time zone is automatically set to your AdWords preference, and you won’t see this option.)

See which pages hold people’s attention the longest.

Probably the report that holds the most important clues about which pieces of content your visitors love is the “Average Time on Page” report. In some ways, this is a more accurate measurement of interest than the report on which pages get the most traffic. Especially if you’re running an advertisement campaign going to a specific page, or when some of your pages are ranking well and driving in a ton of organic traffic.

To see the “Average Time on Page” and rank your pages according to the time on their page, go to “Reporting” > “Behaviour”. In the expanded menu click on “Site Content” > “All Pages”.

In the column on the right you can see the different pages people are visiting and if you click on “Average Time on Page”, the list will automatically sort for you by time on page.

Other interesting sorts you can do on this page as soon as your Goal Data is starting to flow in, is sorting by Page Value. This will give you the insights into which pieces are the most interesting for your visitors and which pieces of content are in serious need of attention for some updates.

Finding slow loading page to optimise your site speed

The last reporting we want to focus on here is the reporting to identify slow loading pages. According to Google, most of the websites out there are too slow.

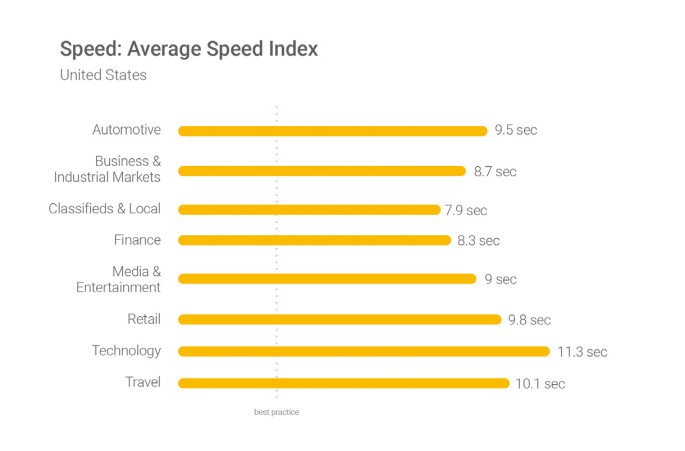
2 seconds is the threshold for e-commerce website acceptability. At Google, we aim for under a half second.” Maile Ohye – Google

In other words, when most websites are ranking above nine-seconds, your visitors are already gone before they have even seen your content.

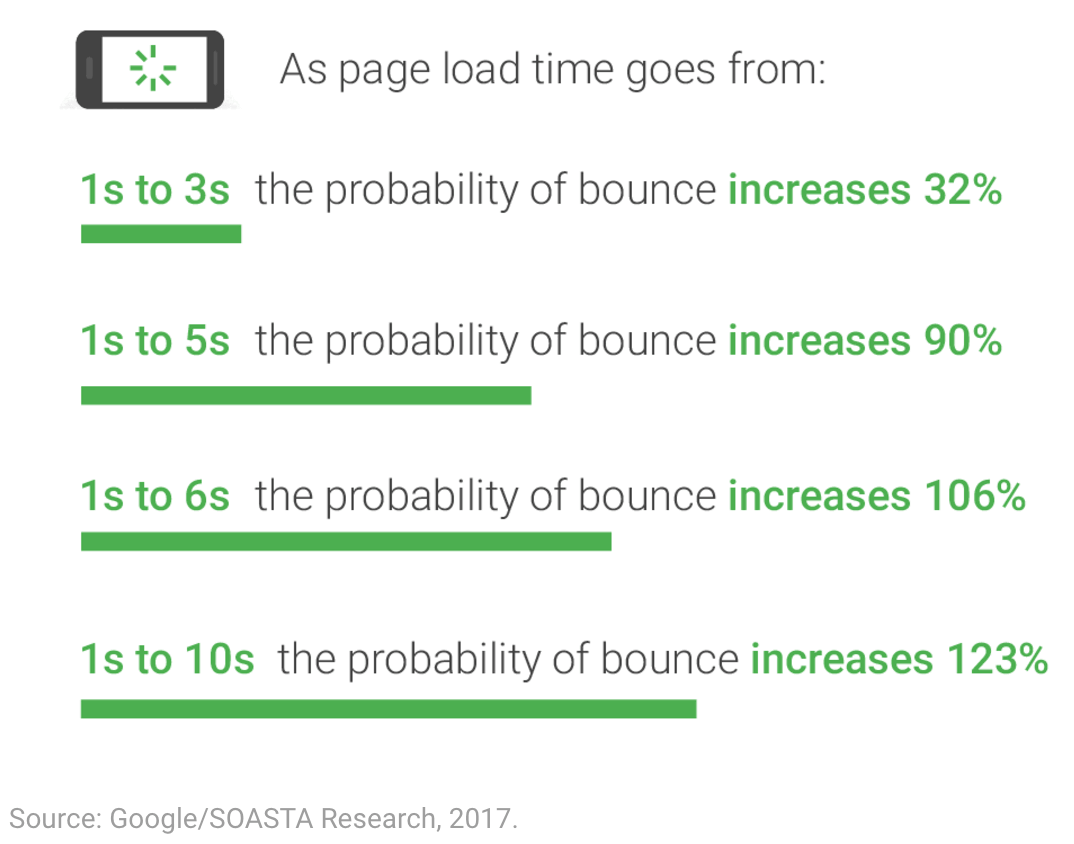
As of July 2018 page speed is a ranking factor in mobile search.

Thankfully using Google Analytics, you can figure out which specific pages on your site are loading the slowest and need some improvement. This information combined which pages are getting the most traffic should give you enough information to figure out which pages you need to start optimising first.

To see the site speed of individual pages, go to “Reporting” > “Behaviour”. In the expanded menu click on “Site Speed” > “Page Timings”.

This report quickly shows you all of your pages on-site, grouped by page load time. Want to know how you can improve them? Just under “Page Timings” in the left-hand menu, you can find “Speed Suggestions”, showing you some great tips to get started.

Advanced Google Analytics reporting

The final item we want to focus on is a little bit more advanced but can give you great insights into finding your most popular content based on the categories and the tags associated with them.

The way to do that is called Content Grouping. According to Google, Content Grouping is:

Content Grouping lets you, group, content into a logical structure that reflects how you think about your site or app, and then view and compare aggregated metrics by group name in addition to being able to drill down to the individual URL, page title, or screen name. For example, you can see the aggregated number of Pageviews for all pages in a group like Men/Shirts, and then drill in to see each URL or page title.

So how to use Content Grouping to determine your most popular content?

It all starts by navigating to Admin and then under the View column you can select “Content Grouping”. Click “+New Content Grouping” and name the first group “Post Categories”.

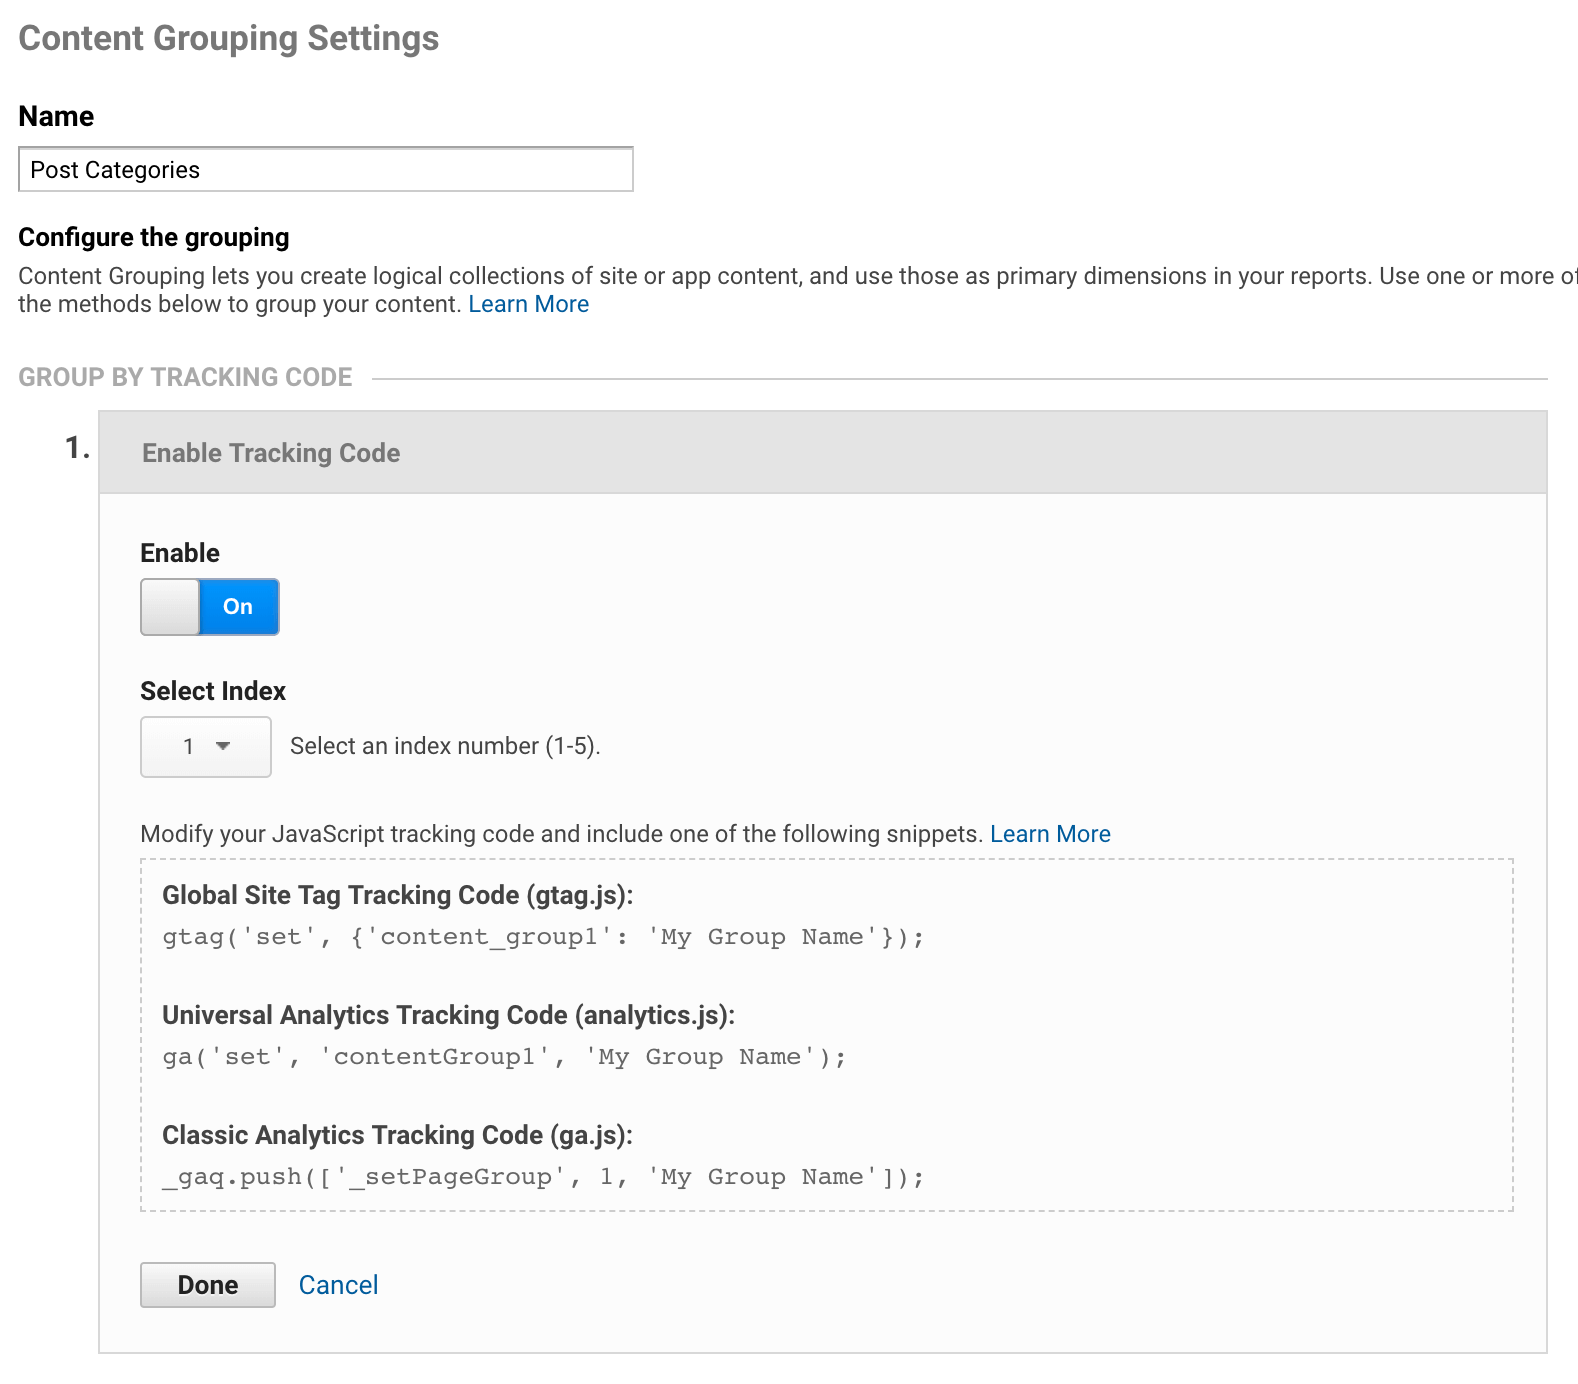
Under “Group by Tracking Code” click “Enable Tracking Code” and write down the number under “Select Index” (unless you’ve already done this before for something else, this should be “1”). Click “Done” and then “Save”.

Repeat the same step, only call it “Post Tags” and write down the index number (probably “2”).

Since we’ve already set up Google Tag Manager, in the beginning, to enable Google Analytics on our website, all we now have to do is head over to Google Tag Manager.

Choose your Account and click on your “Google Analytics Settings”.

Under the “variable configuration,” you click on “More Settings” > “Content Groups” > “+Add Content Group”.

Enter “1” as the “Index” and then click on the icon on the right of “Content Group”. Hit the plus sign in the top right corner for “New Variable”.

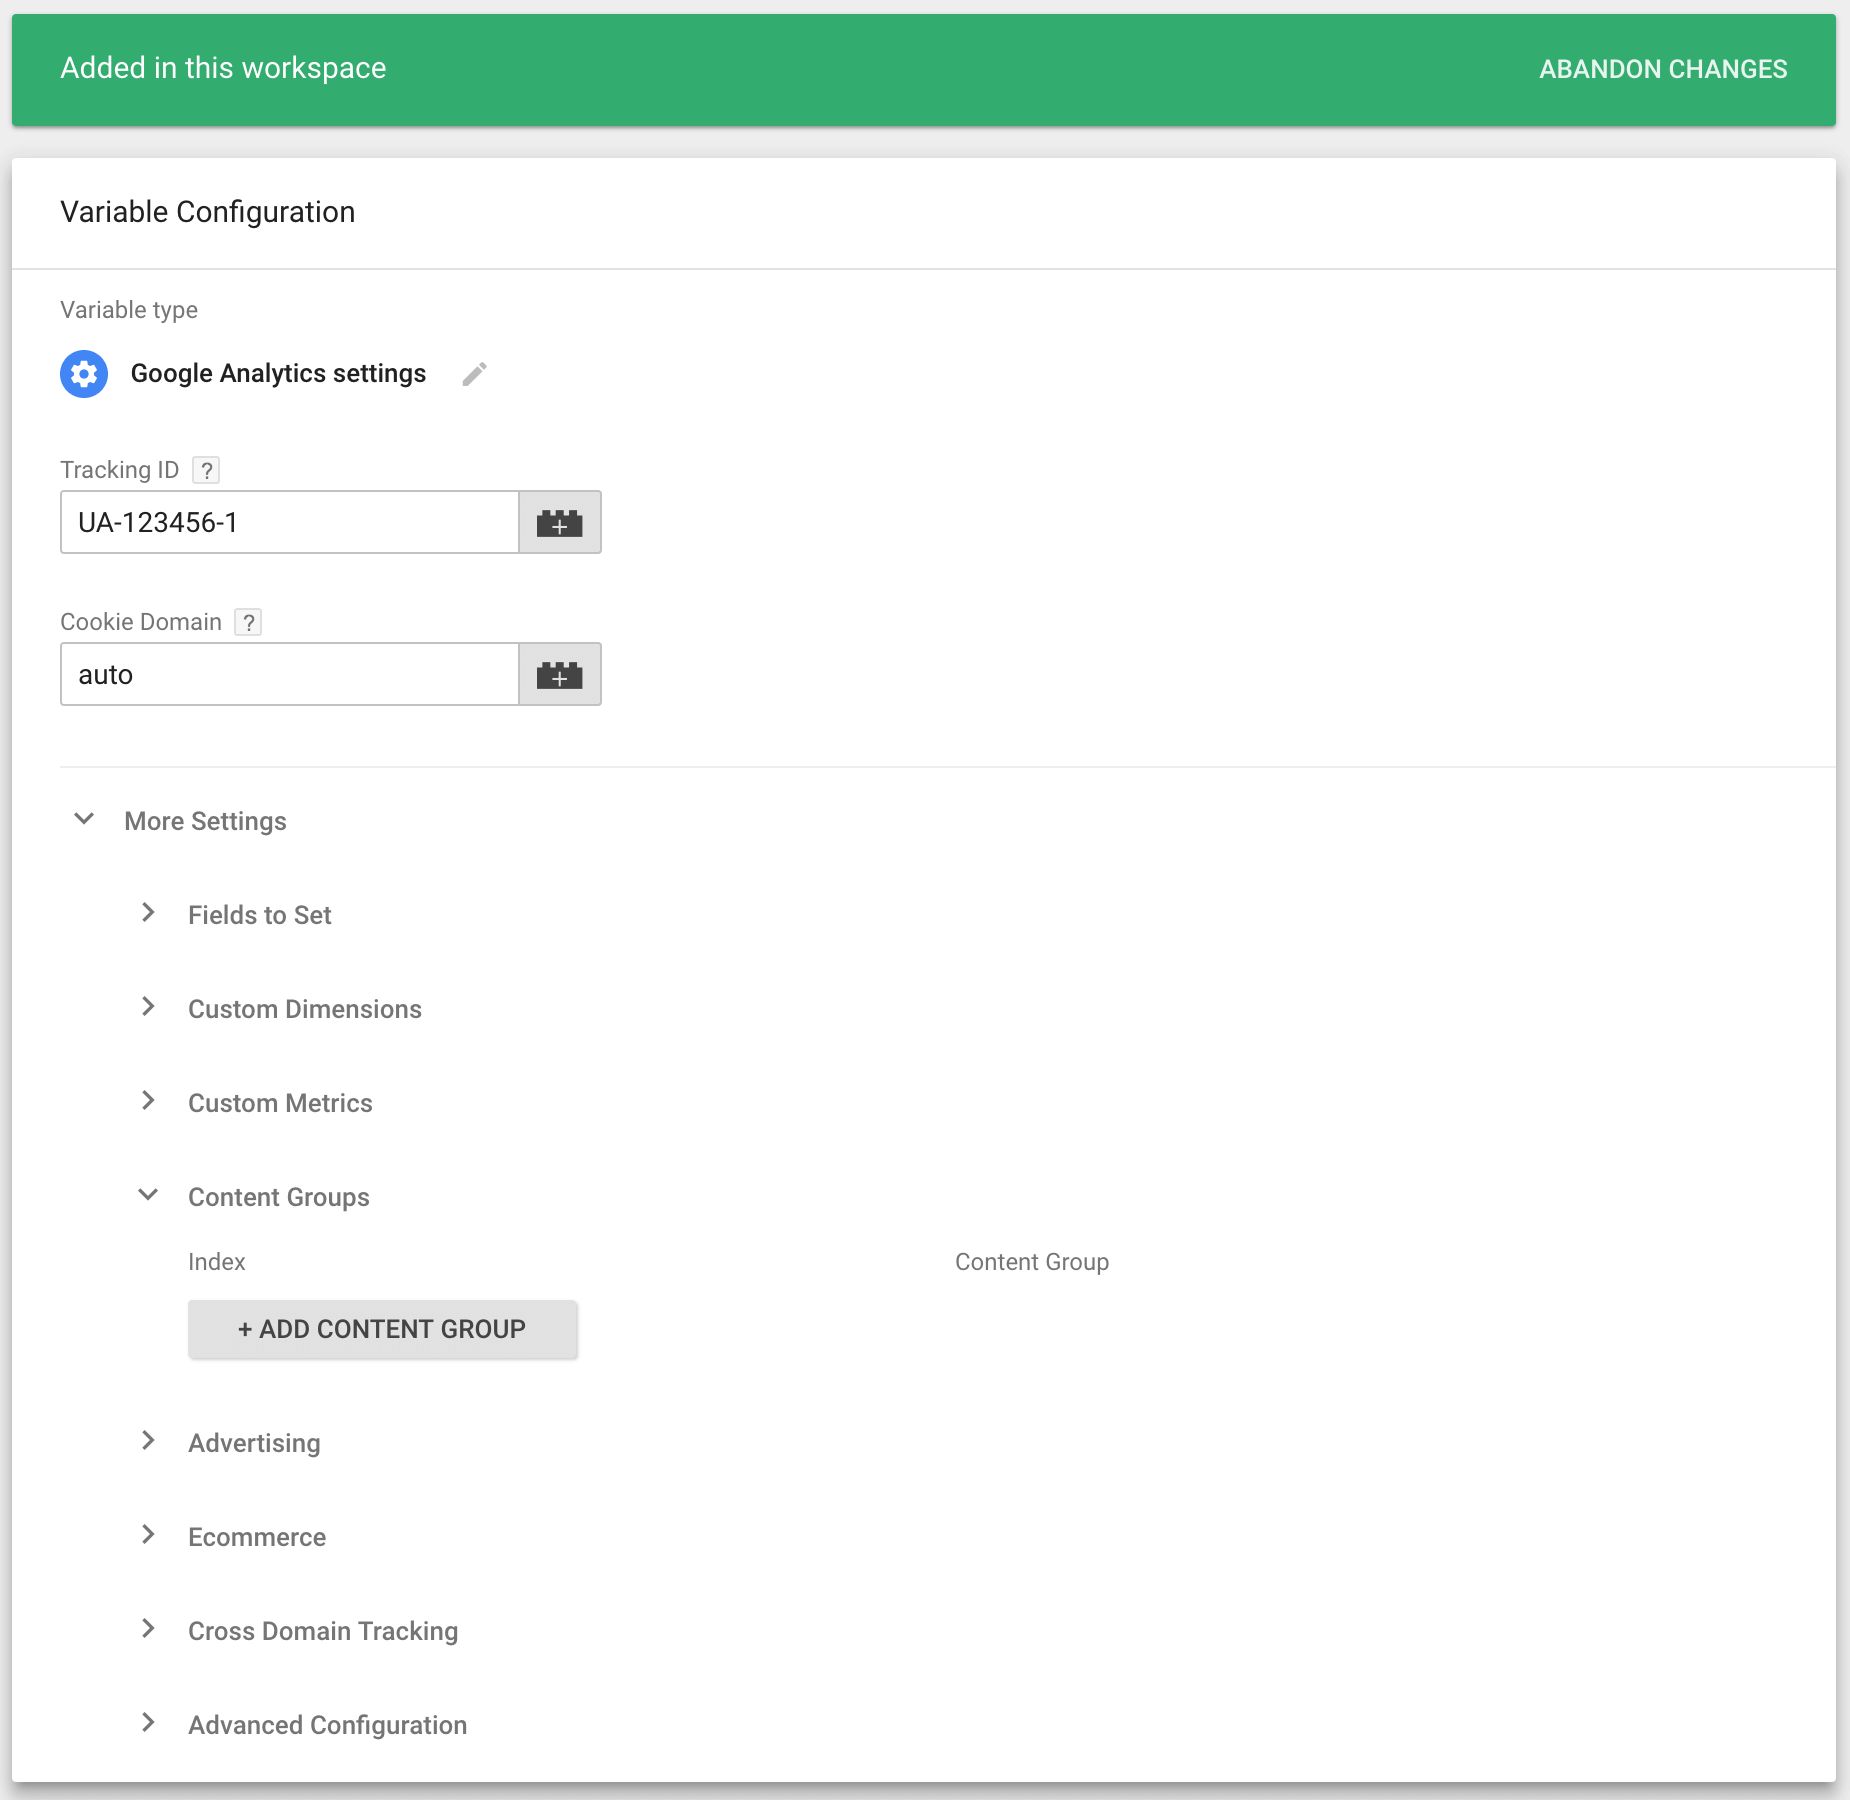
Name the variable “Post Categories” and select “Data Layer Variable” as the “Type”, enter “pageCategory” as the “Data Layer Variable Name” and click save.

Repeat these steps only this time name the variable “Post Tags” and the name for the “Data Layer Variable” is “pageAttributes”.

After that click “Continue” and select “All Pages” under “Fire On” and click “Create Tag” in case that is not selected yet.

Now we head over to your WordPress site and go to the Google Tag Manager plugin we installed earlier. Under the “Basic data” tab, make sure that both “Category list of current post/archive” and “Tags of current post” are selected.

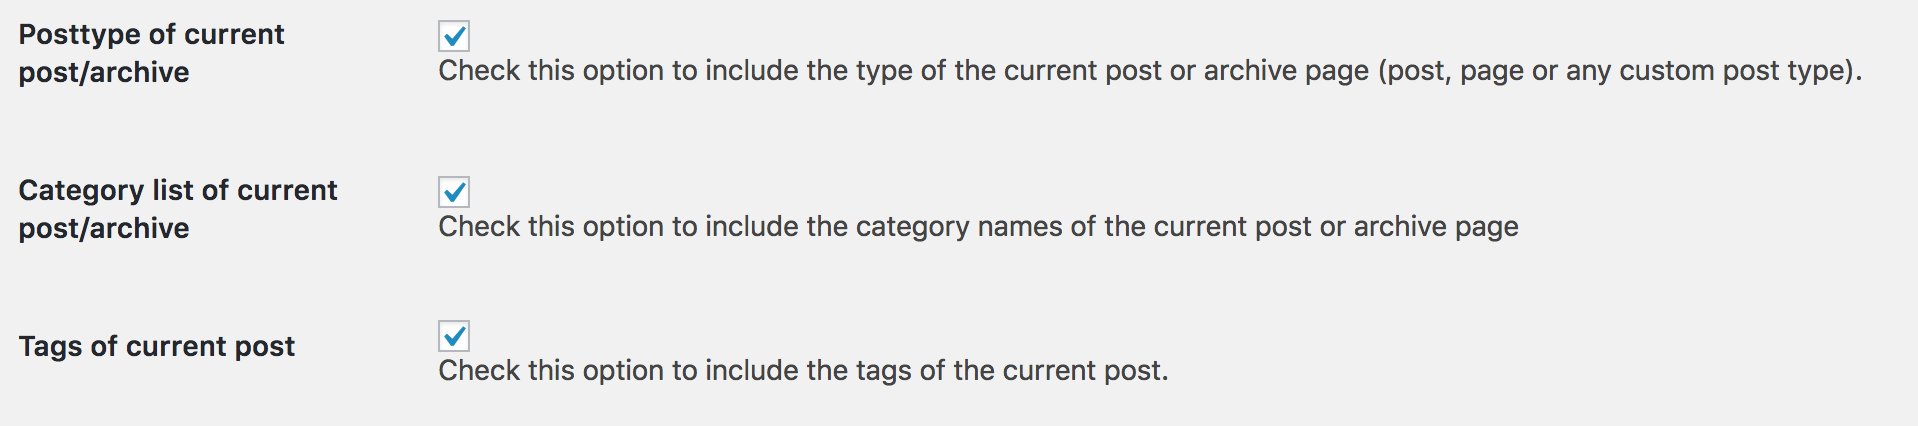
By doing this, we store extra pieces of information in a Data Layer on your blog posts. The post categories and tags can now be used within Google Tag manager for more advanced data collection and reporting.

The final step will be to publish the changes you made in Google Tag Manager.

From now un in Google Analytics, under “Behaviour” > “Site Content” > “All Pages” you will have the option to select information from your content groupings.

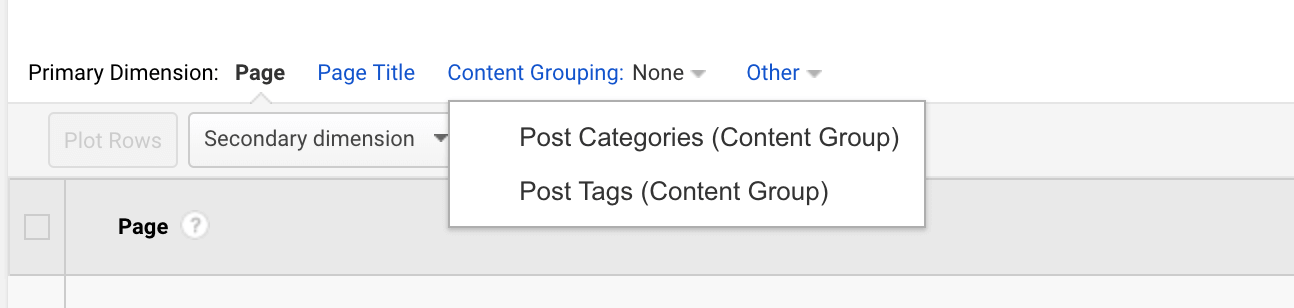
In other words, you can now figure out what are the most visited content categories, and tags that you’re visitors are finding most interesting. It gives you the ability to understand how certain content is performing based on the categories and tags.

Although it is a bit of a top-level view, it can be powerful to quickly understand your top performing content. And as a result, it can help you focus on those topics that your visitors seem to love most.

Google Analytics is an enormous data wonder, and it holds lots of vital data about your website and how it is performing. Best of all, it offers all this data to you for free.
 
As you can see it all starts with a correct implementation though, and from there, there are many different ways to evaluate the performance of your content marketing.
 
Just using standard reports like the amounts of pageviews is not enough if you truly want to move your business forward.
 
If you learn what kind of questions you need to ask for your business, you can start to evaluate your content marketing efforts. 
 
After all, if you don’t measure your content marketing strategy, you don’t what is and what isn’t working.
 
How do you use Google Analytics to improve your (content) marketing strategy? Drop us a reaction in the comments below; we’d love to hear from you.

Sourced from usergrowth

By 

Your international marketing campaigns hinge on one crucial element: how well you have understood your audience.

As with all marketing, insight into the user behaviour, preferences and needs of your market is a must. However, if you do not have feet on the ground in these markets, you may be struggling to understand why your campaigns are not hitting the mark.

Thankfully you have a goldmine of data about your customers’ interests, behaviour, and demographics already at your fingertips. Wherever your international markets are, Google Analytics should be your first destination for drawing out actionable insights.

Setting up Google Analytics for international insight

Google Analytics is a powerful tool but the sheer volume of data available through it can make finding usable insights tough. The first step for getting the most out of Google Analytics is ensuring it has been set up in the most effective way. This needs to encompass the following:

Also read: An SEO’s guide to Google Analytics terms

1. Setting up views for geographic regions

Depending on your current Google Analytics set-up you may already have more than one profile and view for your website data. What insight you want to get from your data will influence how you set up this first stage of filtering. If you want to understand how the French pages are being accessed and interacted with then you may wish to create a filter based on the folder structure of your site, such as the “/fr-fr/” sub-folder of your site.

However, this will show you information on visitors who arrive on these pages from any geographic location. If your hreflang tags aren’t correct and Google is serving your French pages to a Canadian audience, then you will be seeing Canadian visitors’ data under this filter too.

If you are interested in only seeing how French visitors interact with the website, no matter where on the site they end up, then a geographic filter is better. Here’s an example.

Example of geographic filter in Google Analytics

2. Setting up segments per target area

Another way of being able to identify how users from different locations are responding to your website and digital marketing is by setting up segments within Google Analytics based on user demographics. Segments enable you to see a subset of your data that, unlike filters, don’t permanently alter the data you are viewing. Segments will allow you to narrow down your user data based on a variety of demographics, such as which campaign led them to the website, the language in which they are viewing the content, and their age. To set up a segment in Google Analytics click on “All Users” at the top of the screen. This will bring up all of the segments currently available in your account.

Example of user segmentation in Google Analytics

To create a new segment click “New Segment” and configure the fields to include or exclude the relevant visitors from your data. For instance, to get a better idea of how French-Canadian visitors interact with your website you might create a segment that only includes French-speaking Canadians. To do this you can set your demographics to include “fr-fr” in the “Language” field and “Canada” in the “Location” field.

Example of creating a new location-based user segment

Use the demographic fields to tailor your segment to include visitors from certain locations speaking specific languages.

The segment “Summary” will give you an indication of what proportion of your visitors would be included in this segment which will help you sense-check if you have set it up correctly. Once you have saved your new segment it will be available for you to overlay onto your data from any time period, even from before you set up the segment. This is unlike filters, which will only apply to data recorded after the filter was created.

Also read: A guide to the standard reports in Google Analytics – Audience reports 

3. Ensuring your channels are recording correctly

A common missing step to setting your international targeting up on Google Analytics is ensuring the entry points for visitors onto your site are tracking correctly.

For instance, there are a variety of international search engines that Google Analytics counts as “referral” sources rather than organic traffic sources unless a filter is added to change this.

The best way to identify this is to review the websites listed as having driven traffic to your website, follow the path – Acquisition > All Traffic > Referrals. If you identify search engines among this list then there are a couple of solutions available to make sure credit for your marketing success is being assigned correctly.

First, visit the “Organic Search Sources” section in Google Analytics which can be found under Admin > Property > Organic Search Sources.

Example of setting websites as "Organic Search Sources" in Google Analytics

From here, you can simply add the referring domain of the search engine that is being recorded as a “referral” to the form. Google Analytics should start tracking traffic from that source as organic. Simple. Unfortunately, it doesn’t always work for every search engine.

If you find the “Organic Search Sources” solution isn’t working, filters are a fool-proof solution but be warned, this will alter all your data in Google Analytics from the point the filter is put in place. Unless you have a separate unfiltered view available (which is highly recommended) then the data will not be recoverable and you may struggle to get an accurate comparison with data prior to the filter implementation. To set up a view without a filter you simply need to navigate to “Admin” and under “View” click “Create View”.

Example of creating a view without filters in Google Analytics

Name your unfiltered view “Raw data” or similar that will remind you that this view needs to remain free of filters.

Example of creating a new reporting view without filters in Google Analytics

To add a filter to the Google Analytics view that you want to have more accurate data in, go to “Filters” under the “View” that you want the data to be corrected for.

Click “Add Filter” and select the “Custom” option. To change traffic from referral to organic, copy the below settings:

Filter Type: Advanced

Field A – Extract A: Referral (enter the domain of the website you want to reclassify traffic from)

Field B – Extract B: Campaign Medium – referral

Output To – Constructor: Campaign Medium – organic

Then ensure the “Field A Required”, “Field B Required”, and “Override Output Field” options are selected.

You may also notice the social media websites are listed among the referral sources. The same filter process applies to them.  Just enter “social” rather than “organic” under the “Output To” field.

Example of a filter in Google Analytics to reclassify yahoo.com traffic from referral to organic

4. Setting goals per user group

Once you have a better idea of how users from different locations use your website you may want to set up some independent goals specific to those users in Google Analytics. This could be, for example, a measure of how many visitors download a PDF in Chinese. This goal might not be pertinent to your French visitors’ view, but it is a very important measure of how well your website content is performing for your Chinese audience.

The goals are simple to create in Google Analytics, just navigate to “Admin”, and under the view that you want to add the goal to click “Goals”.  This will bring up a screen that displays any current goals set up in your view and, if you have edit level permissions in Google Analytics, you can create a new one by clicking “New Goal”.

Example of creating new goals in Google Analytics

Once you have selected “New Goal” you will be given the option of setting up a goal from a template or creating a custom one. It is likely that you will need to configure a custom goal in order to track specific actions based off of events or page destinations. For example, if you are measuring how many people download a PDF you may track the “Download” button click events, or you may create a goal based on visitors going to the “Thank you” page that is displayed once a PDF is downloaded.

Example of tracking visitors' specific events by setting goals

Most goals will need to be custom ones that allow you to track visitors completing specific events or navigating to destination pages.

With the number of goals you can set up under each view (which is limited to 20), it is likely that your goals will be different under each in order to drive the most relevant insight.

5. Filtering tables by location

An easy way to determine location-specific user behaviour is using the geographic dimensions to further drill-down into the data that you are viewing.

For instance, if you run an experiential marketing campaign in Paris to promote awareness of your products, then viewing the traffic that went to the French product pages of your website that day compared to a previous day could give you an indicator of success. However, what would be even more useful would be to see if interest in the website spiked for visitors from Paris.

By applying “City” as a secondary dimension on the table of data you are looking at how you can get a more specific overview of how well the campaign performed in that region.

Example of adding secondary dimensions to analyze campaign success

Dimensions available include “Continent”, “Sub-continent” “Country”, “Region”, and “City”, as well as being able to split the data by “Language”.

Drawing intelligence from your data

Once you have your goals set up correctly you will be able to drill much further down into the data Google Analytics is presenting you with. An overview of how international users are navigating your site, interacting with content and their pain points is valuable in determining how to better optimize your website and marketing campaigns for conversion.

1. Creating personas

Many organizations will have created user personas at one stage or another, but it is valuable to review them periodically to ensure they are still relevant in the light of changes to your organization or the digital landscape. It is imperative that your geographic targeting has been set up correctly in Google Analytics to ensure your personas drive insight into your international marketing campaigns.

Creating personas using Google Analytics ensures they are based on real visitors who land on your website. This article from my agency, Avenue Digital, gives you step by step guidance on how to use your Google Analytics data to create personas, and how to use them for SEO.

2. Successful advertising mediums

One tip for maximizing the data in Google Analytics is discerning what the most profitable advertising medium is for that demographic.

If you notice that a lot of your French visitors are coming to the website as a result of a PPC campaign advertising your products, but the traffic that converts the most is actually from Twitter, then you can focus on expanding your social media reach in that region.

This may not be the same for your UK visitors who might arrive on the site and convert most from organic search results. With the geographic targeting set up correctly in Google Analytics, you will be able to focus your time and budgets more effectively for each of your target regions, rather than employing a blanket approach based on unfiltered data.

3. Language

Determining the best language to provide your marketing campaigns and website may not be as simple as identifying the primary language for each country you are targeting. For example, Belgium has three official languages – Dutch, German, and French. Google Analytics can help you narrow down which of these languages is primarily used by the demographic that interacts with you the most online.

If you notice that there are a lot of visitors from French-speaking countries landing on your website, but it is only serving content in English, then this forms a good base for diversifying the content on your site.

4. Checking the correctness of your online international targeting

An intricate and easy to get wrong aspect of international marketing is signalling to the search engines what content you want available to searchers in different regions.

Google Analytics allows you to audit how well international targeting has been understood and respected by the search engines. If you have filtered your data by a geographic section of your website, like, /en-gb/ but a high proportion of your organic traffic landing on this section of the site is from countries that have their own specified pages on the site, then this would suggest that your hreflang tags may need checking.

5. Identifying emerging markets

Google Analytics could help identify other markets that are not being served by your current products, website or marketing campaigns that could prove very fruitful if tapped into.

If through your analysis you notice that there is a large volume of visitors from a country you don’t currently serve then you can begin investigations into the viability of expanding into those markets.

Conclusion

As complex as Google Analytics may seem, once you have set it up right expect to get clarity over your data, as it makes drilling down into detail for each of your markets an easy job. The awareness into your markets you gain can be the difference between your digital marketing efforts soaring or falling flat.

Feature Image Credit: shutterstock

By 

Helen Pollitt is the Head of SEO Avenue Digital. She can be found on Twitter @HelenPollitt1.

Sourced from Search Engine Watch

By 

The goal of Google Analytics is to help you as a business owner to deliver a high-quality website to your customers and provide you with all the necessary information regarding the website statistics

Google analytics might seem scary at the first site. But you are an accomplished owner of a dynamic and customer-focused small business and your website represents your business! So, being inquisitive about the traffic data is your religion. As a fact, you want to know much more than just traffic data.

To give you a broader overview of what Google Analytics does, it helps businesses gain insights on their website’s traffic, where the visitors are coming from (channels, mediums, source, referrals, paid channels), which keywords draw the most traffic, what pages are visited most etc!

The data can then be drilled down to see the page views, sessions, bounce rate, new vs returning users, and session duration. Further, drill down the data to see what time of the day the users visit, what browser they visit from or what device they access your website from, the behaviour flow etc.

Google Analytics not only provides you with a lot of data, but it also pushes you in the right direction when it comes to your website optimization. You can actually get insights on whether you need to optimize the on-site SEO of your site or make your site more mobile friendly or whether to improve the website’s speed etc.

We will take a detailed look into all these in a moment and analyse how Google analytics helps business owners take important business decisions based on a huge amount of real data points. If you are a novice when it comes to Google analytics, this is the post that will push you in the right direction.

[1] Google Analytics Reports – The holy grail for understanding your website traffic

Audience Overview report :
Audience overview reports provide information on your website’s traffic at a glance. Along with that, it also provides insight into the characteristics of your users. It gives you details of your audience’s cohort, demography, age, the technology they use, behaviours and interests of your website visitors.


Image Credits – Moz

How does Audience overview report in Google Analytics help your business?

[i] As a business owner, it is paramount that you can comprehend what kind of audience your website is drawing and whether that is the customer persona you are targeting. Audience overview report pushes you in the right direction by providing clear and consistent frames of reference backed by a whole lot of data.

[ii] Once you gain insights on your customer behaviour, you can leverage it to formulate marketing strategies to increase engagement with them. It will help you target your niche audience.

[iii] Also, this helps you keep a check on how your business is doing compared to your competitors. All these extremely useful data can be used to optimize your site’s performance in order to make it more target-customer centric.

Customer Acquisition Report

This report in Google Analytics tells you from what channels and sources your website visitors landed on your website, such as search engines, social networks or referrals and what campaigns are drawing how much traffic. Acquisition report basically helps determine which marketing tactics are working and which are not.


How does Customer Acquisition report in Google Analytics help your business?

This report is an overview of your marketing tactics. This report lets you know what kind of content your audiences are enjoying and which digital marketing channels are the most successful for your business. Leverage this data to develop and optimize marketing strategies that result in higher conversions.

It can help enhance the SEO and the UI/UX of your website. If you see some pages having a high bounce rate, then divert your attention to analyze why users are abandoning those pages.

Acquisition report helps you track which sites are responsible for most referred traffic to your site and focus on developing strategies to gain more referrals from them.

Real-time Behaviour Report

With the help of real-time reports on Google Analytics, you can monitor website activity as and when it happens, i.e. in real time. You can get an overview of the no. of people that are on your site right now, which pages or events they’re interacting with, and which goal conversions have occurred. You can also continuously monitor the effects that new campaigns and site changes have on your traffic.


How Real-time reports in Google Analytics help businesses?

[i] Time-specific content marketing – With real-time data, you will get insights on when there is more number of visitors on your site; so, you can push content to your blog around that time. This will give your content a boost and increase exposure.

[ii] Also, it will give you an idea of how engaging your content is. If people are bouncing off the content too soon, you might start thinking of something else.

[3] You can also view the behaviour of your visitors with real-time analytics. This will help you get details about what is working and what’s not. Say your visitors land on your “Contact us” page but bounce before filling the form. Here you know that you will need some alterations to keep visitors engaged.

Point to remember: In order to take better decisions, make sure you avoid inflating your own website traffic. This can be done by filtering out your own IP Address.

Moving to a little more advanced Google Analytics level :

[2] Segmentation with Google Analytics :

Segmentation is a way for businesses to understand the behaviour of various groups of users (segments) on your website. It shows data based on certain criteria and tells you how different group of people (segments) interact with your website, such as all data for visitors from the United States. It also compares the performance of that segment to the performance of the whole site.


How Segmentation in Google Analytics helps Small businesses?

[i] As data is found in abundance in Google when businesses start out, they might have trouble coming to a conclusion with all that data. Segmentation converts quantitative data to qualitative data with respect to your specific business requirements, making it easier for small businesses to interpret and analyse the data.

[ii] Small business owners can segment traffic by date and time, traffic channel, geographical region etc.. You can also create custom segments to measure various sales funnel benchmarks like reaching CTA button, adding products to cart, reading your blog etc.

[iii] Segmenting website visitors in groups and targeting campaigns w.r.t each group and comparing one segment to another – really helps to derive various insights in the interest of your business. Analyse them and use them to drive campaign success as well as conversion.

[3] Setting up Goals in Google Analytics

Goals are basically created so that Google Analytics can let you know when something important has happened on your website. Goals in Google Analytics allow you to track specific user interactions on your site.


How Goals in Google Analytics Helps Your Business

[i] Businesses can set goals to keep track of specific URLs. Whenever that particular URL is visited, the goal will be triggered. Say thank you pages or order confirmation pages. This will help you know the number of completions within a specific period of time.

[ii] Businesses can set goals to track the no of users that spent a certain amount of time on your site. Also, track the no. of users that don’t spend that time on your site. This way you can track both customer engagement and also how fast your customer service provides support.
[iii] Set up goals to see the number of pages each visitor sees before they quit the website. This is also used to measure engagement. This is of help for eCommerce businesses who might want to analyse the actual users who are looking to buy.


[iv] Google Analytics also lets you set up goals when users take some specific action on your website like plays a video, shares some piece of content etc. For businesses that have a unique content strategy like video, marketing can totally use this method for their advantage.


[4] Customized Reports and Google Analytics

Google analytics has too much data, but only a portion of it is used to draw meaningful conclusions and help you optimize and make better business decisions. The reports that Google Analytics provides are okay for surface level data and offer a glimpse of what’s actually going on.  Also, sorting through all that data manually is time-consuming. What custom reports do is, it collect all the data and presents them in a format that is easier to analyse.


How Does the Custom Report in Google Analytics Help Businesses?

[i] All businesses have unique strategies and thus they need specific data and more importantly, customizable analytics. With custom reports, businesses can drill down into fine details and discover correlations you wouldn’t see otherwise.

[ii] Custom reporting dashboard provides a consolidated all in one view that can be digested easily and is simpler to share and export. Also, there is provision for the dashboard to be emailed to you as a pdf either daily or weekly.


[5] Setting Custom Alerts in Google Analytics

It so happens that sometimes there is a huge dip in the web traffic or a huge drop in conversions. Manually attempting to track these fluctuations would mean keeping your eyes glued on Google Analytics 24/7. Well, you have better things to do. But again, keeping a tab of the critical fluctuations is important. Lucky for both you and me, Google Analytics came up with custom alerts to help track these variations for your website. Create custom alerts for data that are most significant and meaningful for your business and Google Analytics sends a custom notification if a change triggers one of your custom alerts. Also, you can create annotations about an alert so that you can come back as and when required to see why that alert occurred.


How Does Custom Alert in Google Analytics Help Businesses?

Stay on top of your website performance and react accordingly and make necessary changes when notified. Traffic spikes after a new campaign can indicate that the campaign is performing as expected.


[6] PPC Campaign and Which Channel Converts the Most Customers

Anyone using PPC advertisements knows that it is a key revenue driver for their businesses but also know how expensive it can get! Integrate your AdWords account with your Google Analytics and carry out a PPC audit in Google Analytics to ensure all clicks are reported accurately in Google Analytics. This will help make informed decisions.


How Tracking PPC Campaigns in Google Analytics Help Small Businesses?

[i] Adwords already show you which keywords and ads initiate the maximum conversion. Google analytics, in addition to that, will show you the customer journey, so, you’ll get an idea of what factors on your website influence the conversion rate.

[ii] With Google Analytics, you also get additional data like bounce rate, Pages Per Visit, repeat customers etc to optimize your AdWords Campaigns and make more informed business decisions.


-:: Parting words::-

The goal of Google Analytics is to help you as a business owner to deliver a high-quality website to your customers and provide you with all the necessary information regarding the website statistics. So, they let you know who’s visiting your site, who are converting and who’s not interested. Along with these which location they hail from and what social or referral channels bought them here. It also lets you set up goals and segregate your traffic. Then it helps to present all these data in an all-in-one view dashboard so that analysing all that data and taking suitable actions becomes easier for you. So, Google Analytics basically helps you market to the right people, in the right way and at the right time.

Feature Image credit: Shutterstock 

By 

CEO of Binaryfolks Pvt. Ltd.

Sourced from Entrepreneur India

You have crafted your blog strategy, painstakingly laid out an editorial calendar, and spent countless hours (and perhaps precious cash) creating blog posts for your business. How do you know if your effort is paying off? You can determine whether your content marketing strategy is failing or succeeding with a few simple steps.

Start by Understanding Your Goals

First and most importantly, understand the goal of your blog. Is it designed to establish thought leadership for your brand, generate leads, build up your social following, better understand your audience, etc.? It may sound obvious, but specifying your goals is a necessary first step prior to analyzing whether you’re achieving them.

Use Google Analytics for Fundamental User Metrics

Analysing Google Analytics (GA) trends is a good place to start when monitoring your content quality. GA is a free, richly featured, powerful analytics tool provided by Google. Setup is as simple as installing a snippet of code in your global site header. Once installed, GA will provide a wealth of information on user behaviour on each page of your blog. You can obtain this information by navigating to “Content,” and then “User Behaviour,” and then filtering by “blog.”

There are a few key stats to pay attention to in GA. You’ll want to monitor the following across all posts and for individual posts:

• Pageviews indicate whether your topics and headlines are interesting and SEO friendly and whether your blog posts are being shared socially. Pageviews are affected by a variety of factors such as content quantity, content quality, and promotion on social platforms and in email newsletters.

• Bounce Rate & Exit Rate help you understand whether users are proceeding to other posts after reading a given article. A Bounce occurs when a user’s first-page view on your site was also their last. An Exit indicates that a user left your site after viewing a given page. These metrics tend to be a measure of your content quality, and also how well you are cross-promoting your other blog or site content.

Layer in Social Sharing Behaviour

Next, you’ll want to understand the virality (defined as “the tendency of an image, video, or piece of information to be circulated rapidly and widely from one Internet user to another”) of your content. The primary reason for this is to understand overall sharing behaviour, but a close second is to understand how your content is shared on various social platforms. You might be surprised to find, for example, that your content is more likely to be shared on Facebook than on Twitter or LinkedIn.

Share count alone won’t tell you much, however, without factoring in the number of page views. The not-so-obvious key metric that is truly indicative of content virality is Share-to-Pageview ratio. This metric indicates if your content topic was interesting and the quality was good; or to put it another way, whether the content delivered value based on the expectations set by the title of the post.

Look for trends in the data

Now that you’ve created a content dashboard, you can analyse the overall effectiveness of your blog, and more importantly the effectiveness of individual posts. In a short period of time, you will be able to identify trends that will inform your future content creation and allow you to understand the impact of factors such as content quality, quantity, and promotion on your content page views and shares.

Examples of content trends in the dashboard:

Topics – Which topics or themes tend to resonate with your audience? You’ll likely want to create more content on these topics or themes in the future. Conversely, content that seems to be of little interest to your audience can be removed from your future editorial calendar.

Titles – Do certain title styles resonate more with your audience? Some audiences may prefer a straightforward title, while others may prefer a listicle format, like top 10 lists, and others may prefer teaser-style headlines. Identifying title trends will help you make sure future content is more likely to be read by your audience.

Authors – Perhaps certain authors have higher pageview and shares than others. When that happens, make sure you are maintaining a good relationship with the successful authors, and consider increasing the frequency of their posts.

These are merely a few examples of trends to illustrate the power of maintaining a blog dashboard. You will likely identify other trends relevant to your specific business and blog.

Following these straightforward steps, you should be able to move forward on your blog strategy with confidence. Updating and review the dashboard with your content team once per week will ensure that your blog is tailored for your audience and that your content’s quality, quantity, and discover-ability are meeting your expectations.

Feature Image Credit: (iStock/RichVintage) 

By 

Sourced from Black Enterprise

By

f there is an unsung hero in Google Analytics, it is definitely something called content groups (or content grouping). Never heard of it? It is hiding in plain sight, in your Google Analytics view settings, and can be set up in a couple of clicks. Once content groupings are set up, you will always want to use them.

Ready? Get some coffee, snacks, and let’s go build some content groups.

What are content groupings in Google Analytics and what do they do?

Simply put, content grouping allow you to create… wait for it… groups of content. Many times you will want to see consolidated reports on multiple elements and dimensions without having the possibility to see them grouped together as one entity.

Imagine you run a bilingual site like this blog but don’t necessarily have the URL structure to distinguish between languages. Imagine you run a news site made up of content sections such as politics, finance, sports, culture, etc. Imagine you run an e-commerce site with departments and product categories.

In the case of the multilingual blog, I want to see an overall view of my content’s consumption in terms of language.

In the case of the news site, I want to see which sections were read the most and which were read next.

In the case of the eCommerce website, I want to see whether my users are browsing within the same product category or exploring other products.

Creating content grouping

First things first, go to your Google Analytics admin panel and locate your view, as shown below:

You should be seeing an empty table, but I’ll show you how mine looks in the test view we’ll be playing with:

List of content groupings in Google Analytics

As you can see in the example above, I’m using up all 5 content groups allowed per Google Analytics view. I can create more groupings in another view if needed.

In your case, you should have a big red button called New Content Grouping . Click it. CLICK IT NOW.

The first thing we’ll do is give the new content grouping a name. If we use the eCommerce website example, let’s imagine it’s a clothing store – with 3 major sections: women’s clothing, men’s clothing and children’s clothing. With that in mind, let’s name the new content grouping Product section.

Next, I have to choose from three options in order to give my content grouping a value:

  1. Group by tracking code: relies on what information is sent to the Google Analytics tracking call, using Google Tag Manager for instance. This implies your tracking code / data layer includes the information required, with a productSection dataLayer entry for instance. Probably the safest option, assuming you can handle the related development.
  2. Group using extraction: here we’ll be looking at patterns in URLs and capture the strings in the URLs that match the pattern. Expect to use regular expressions.
  3. Group using rule definitions: with this option we can specify a value that applies when conditions are met, based on URL, page title or screen name. Basic but powerful, assuming you’re ready to handle lots of unique cases.

Actually, let’s tackle them in reverse order!

Group using rule definitions

This is going to be the most common way you use content groupings. Why? Because accessing your site’s URLs is the easiest way to find patterns and use them to create logical groups.

For instance, If we want to give our Product section content grouping a value based on URL rules, we can create a new rule. As shown below, we are creating a value of “Kid’s clothing” for pages where the URL contains /kids or /children. Yes, you can use regular expression as well as AND and OR conditions, which make rule creation a breeze.

Creating content grouping in Google Analytics based on rule definition

Another example is what I use to measure how much content on my site is served as AMP.

The above definition means I can now look into my Behavior > Site Content > All Pages report and use my content grouping as the main dimension:

Using a content grouping as main report dimension

Then once you select your content grouping (AMP in this case), your report shows you that consolidated view you’ve been waiting for:

Neat, right?

Group using extraction

We got the fun part done with the previous grouping method but the extraction method can be interesting too! In the example below, we use a regular expression to capture part of the URL folder structure that immediately follows the /products/ folder. In our case we assume URLs in the form of /products/mens/shirts.html. As with regular expressions, whatever sits inside the parentheses is captured to be used later. If the regexp is set to /products/(.*)/.*.html and using the above test URL, we’re going to captures mens and store it as the value for our content grouping.

Sounds straightforward, yes? Good – now for the best bit.

Group by tracking code

Grouping by tracking code is a lot more elegant, especially if you work with a tag management system such as Google Tag Manager. Essentially, you need to select your content grouping’s number (index) from 1 to 5 and pass a value to it.

Let’s examine the Google Tag Manager methodology. Assume you can generate the following data layer for any given page:

var dataLayer = window.dataLayer || [];
dataLayer.push({
  "productSection": "Men's clothing"
});

In Google Tag Manager, create a variable based on your productSection data layer variable:

Next, in your Google Analytics page view and event tags (or even in your Google Analytics configuration variable), setup your content group to use your new variable:

Using Google Tag Manager variables to populate content groupings in Google Analytics tag

Publish your GTM container and voilà! You have an elegant solution for content grouping that does not rely on URL-based rules and can easily integrate with your content management system.

But wait, don’t we have custom dimensions for that?

Ah, an astute remark! Custom dimensions are indeed available for a similar purpose, with the addition of specific scopes (user, session or hit), whereas content groupings are hit-based. Furthermore, custom dimensions are pretty much expected to be set in the tracking call, whereas content groupings can be set using URL rules, extraction, or tracking code, making them a bit more flexible than custom dimensions.

As mentioned before, the main advantage of content grouping over custom dimensions is pathing. You can see how content grouping can be included in a flow-type report:

If I use my content publication year content grouping, I can see if users navigate from older to newer posts or the other way around:

Using content groupings as high level navigational elements

Of course this method works great with the news site or ecommerce site examples I mentioned earlier.

In closing

If you hadn’t heard about content grouping in Google Analytics before this post, something tells me you’ll be using them very soon.

By

Sourced from https://juliencoquet.com

By Brett McHale

One area that seems to elude many digital marketers is the relationship between conversion tracking and website analytics. Often, when businesses get started with online advertising, they have established each piece of the puzzle separately, with Google Analytics monitoring site traffic, and paid channels (like Facebook and Google Ads) tracking conversions individually within their respective dashboards.

This set-up may be effective on a small scale, but it will inevitably cause issues when your efforts expand. Having the proper tracking to view granular paid channel performance in Google Analytics will allow you to add another layer of attribution to hold each channel accountable for what’s really happening on your website.

In addition to Analytics, Google offers tools to streamline the process of managing website pixels and conversion tracking for each channel. With the combination of clean conversion tracking and reliable analytics, you should be able to scale your paid programs without having to worry about whether the information you’re looking at is accurate.

In this post, I’ll walk you through how to use Google Tag Manager and Google Analytics to improve your paid channel performance reporting in four steps.

Step #1: Implement Google Tag Manager

Google Tag Manager allows you to implement and manage the tags on your site in one place. This means you only have to place a snippet of code once across your site as opposed to manually inserting a tag from every channel individually. After the GTM tag is implemented, you will be able to add and manage tags all in one place. The reason I start here is that many advertisers will manually place each paid channel’s tracking pixel individually on the pages of their website. This can create confusion and clutter within your website’s code. To simplify the process of adding multiple pixels and tracking codes to your site, I highly recommend setting up Google Tag Manager as soon as you can. This will also make the life of your future web developer much easier if your team and operations scale.

To get started with tag manager you’ll have to create an account.

getting started with Google Tag Manager

Once there, you’ll want to follow the steps for establishing your account information. Name the account after your business and continue to set up the “container.” The container will be your website address:

set up Google Tag Manager account

You’ll want to select “web” before proceeding. Google will then generate two tags for you to place across your site.

install Google Tag Manager

The top tag will be implemented within the <head> and the second after the opening <body> tag. It’s a good idea to copy and paste these tags and save them in a document so that you can easily access them at any time. If you use a platform like HubSpot to manage your site, it’s rather simple to apply these tags across all web pages quickly.

Keep in mind that if you use a third party for landing pages, you’ll want to have this code injected there as well.

Before you implement the GTM tag across your website, you’ll want to remove tags from any paid channels that had been previously manually installed. You will be able to transfer these tags to GTM afterwards, but removing them in the meantime will ensure that those tags aren’t firing multiple times or causing issues once the GTM tag is in place. It’s also a good idea to save these pre-existing pieces of code in a document – I’d suggest the same one that you have the GTM tags in for safe keeping. If you are managing accounts for clients, make sure that they give you publishing permissions in their GTM. This will allow you to create new tags and publish them on your own.

For Facebook, there is a quick way to implement the pixel into GTM. After you finish setting up your Tag Manager account and remove pre-existing paid channel tags from your site, go to Facebook Business Manager and select “Pixels” from the main drop-down menu:

Facebook Pixel

Select “Set Up Pixel”:

select "Set Up Pixel"

Then select “Use an Integration or Tag Manager”:

Google Tag Manager pixel options

This should then allow you to choose Google Tag Manager from the list and follow the walkthrough to easily implement the pixel. In Google you can add your conversions by going to Tools > Conversion > and then selecting the specific conversion you would like to add. At the bottom of the page there should be an option for “Tag Setup.” There you will be able to select the Google Tag Manager:

choose to install using Google Tag Manager

This will provide you the information you need to create the conversion in Google Tag Manager. This includes the conversion ID and conversion label.

To create a new tag for any channel, select “New Tag” from the Google Tag Manager home screen and then choose the channel you want to set up:

Google Tag Manager home

When doing so you will be prompted to choose how each tag fires or when it is “triggered.” For Tags like LinkedIn, Facebook, and Google Remarketing, you’ll want to set them to fire on “All Pages”:

LinkedIn Insight

For something like Google Ads conversion tracking, you’ll want to have the tag fire only on specific page URLs:

choose specific pages for trigger configuation

Here, you can specify which pages you want the conversion to fire. For example, “thank you” pages or any destination page associated with the conversion. After doing so, you also have the option to add a conversion linker to the pageview event. Conversion linkers are used to help tags measure click data so that conversions are measured effectively. To add a conversion linker tag, simply select “New Tag” and “Conversion Linker” from the tag configuration menu:

Google Tag Manager configuration menu

Then you’ll want to have the linker trigger to “All Pages.”

Once you add in your tags from each respective channel, select the “Submit” button at the top of the page. This will push the changes you made to Tag Manager Live:

push tag manager live

To ensure that your GTM is firing properly, I suggest downloading the Google Chrome extension Tag Assistant. This plug-in will allow you to see which tags are live on specific web pages.

You can also get the Facebook version of this tool to ensure those tags are firing as well.

To use these tools, go to your website and enable the Tag Assistant extension:

Tag Assistant extension

Here you can see the two tags are in place and firing. This is a good way to ensure you removed old tags properly without having to dig through each page’s code.

Step #2: Set Your Google Analytics Goals

The essential piece of the reporting puzzle is tying Google Analytics Goals back to your efforts in paid media. In case you haven’t established Google Analytics Goals yet, I’ll walk you through the process.

Sign into your Google Analytics account and select the proper view for your website. On the left-hand side, select “Admin” (FYI, you’ll need to have admin privileges in order to create goals in Analytics).

go to Google Analytics Admin

After that you’ll want to select “Goals” from the desired view:

select Goals in Google Analytics

From there you can view existing goals or create new ones. You’ll want to ensure that the goals that exist or the ones that you create are synonymous with your paid advertising conversions, like demo requests, ebook download, free trial start, purchase, or add to cart. You have a few options when it comes to creating the types of goals you want, including goals from a template, custom goals, and smart goals. I recommend creating custom goals because they allow you the flexibility of specifying destination URLs:

select goal type in Google Analytics

The idea here is to create goals that are identical to the conversions you have in place within your paid channels. For example, if you are driving traffic to an ebook landing page on Facebook, then you will want to have ebook “thank you” pages established as goals within Analytics. In a scenario like that, you’ll want to select “Destination.” From there you will be able to specify the destination landing page for the conversion event in the same way you would in your paid platforms. Assuming Tag Manager is properly established, you will be recording conversions within each individual channel respectively – with goals set up in Analytics for those conversions, you can now use Analytics to compare and ensure that the results are comparable.

Step #3: Start Using Analytics URL tracking

In order to see the specific source of traffic in relation to the goal completes, you can use Google’s URL campaign builder.

Here, you can create unite URL UTM parameters for each specific paid channel campaign. Under “Campaign Source,” you can put the respective channel (Facebook, Google, LinkedIn, etc). After having everything set up and your campaigns running, you can then go to “Goal Flow” underneath the “Conversions” section in Analytics:

select Goal Flow in Google Analytics

From there, you can then select one of your custom goals in the top right and view the amount of goal completes from each respective channel. For example, ebook downloads:

example of goal flow in Google Analytics

There are other ways to get channel visibility like this, but I found this to be the simplest way to do it.

Step #4: Keep Track of Your Reporting

After you have Google Tag Manager and Google Analytics set up for your desired conversions for each channel, you’re almost done. Because you’ll be able to see what channels are driving which goals, you’ll want to make sure you’re keeping on top of regular reporting to make the most of this information.

If you’re seeing numbers that are not aligning to your reports in Google Analytics from Facebook, for example, you can go into your custom conversions and see if there is an issue there (on the Facebook level). The idea is to make Google Analytics your source of truth when tying back costs from your paid efforts. You will also be able to use Analytics to monitor page traffic and the associated metrics for pageviews and bounce rate (this comes in handy as Facebook’s click data is usually far from accurate). You will also be able to get insights into how users are interacting with the rest of your site after entering through a paid channel. For example, a user lands on your site through and ad but navigates to another page and converts. You will be able to see this information and tie it back to the overall paid ROI.

If you want to consolidate all of this data into one simple dashboard, consider using a tool to connect your accounts and create reports automatically. Some good options include Databox, OpenStack, and WordStream Advisor.

With Google Tag Manager and Google Analytics goals working in harmony, your paid channel reporting will become streamlined and a lot more accurate. If you ever wondered what results you actually received from paid advertising, having these systems set up is the first step towards clarity.

By Brett McHale

Brett McHale is the founder of Empiric Marketing, a digital marketing agency dedicated to scaling startups through paid search and social.

Sourced from WordStream

By Choncé Maddox    

Operating with the right online business tools can eliminate a ton of stress for you as you manage your workload each day. Whether the tools is paid or free often doesn’t matter.

It’s all about how well you can use the tool and how it helps improve your processes. Often times, the affordable or free online business tools can do the trick and exceed your expectations.

Here are 5 online business tools to better understand in 2019.

1. Google Analytics

If you have a website, you should definitely be using Google Analytics to track your page views and learn more about your audience. Google Analytics can be used to completely analyze this critical data.

Aside from tracking page views, you can determine where visitors are coming from (referral sites and traffic), where they live, how long they stay on the site, etc. If you haven’t yet, do a full run through of all the features Google Analytics offers so you can make the most of this free tool.

2. Asana

Asana is another one of the top online business tools to master in 2019. It’s a project management system that has a free and paid version. I use Asana to assign tasks to myself and my team to help us keep up with deadlines and organize everything in one place.

Still, you can take Asana to the next level by using some of their advanced features like creating specific projects and recurring tasks. Use their tutorial and virtual tour to run through all the features.

3. Calendar

Having trouble organizing your schedule and planning meetings? If you don’t have an online calendar system, it’s time to consider one. Human error can pose many setbacks when you’re trying to be productive in your business.

Calendar is an online tool that utilizes the power of machine learning to offer you smart suggestions on when, where, and how your meetings can take place.

This is a great tool if you often get overwhelmed with the idea of scheduling and attending meetings while balancing work or if you often overbook yourself. Using Calendar will help you easily scheduling meetings and events when it’s most convenient for you.

4. Moz SEO

If you’re looking to improve your SEO in 2019, Moz is a must. It’s an SEO software program with free and paid versions.

With the free version, you can research keywords and research SEO data for your competition. There on limits to how many sites you can pull data on for the free version, but it can still be super helpful. Moz has a 30-day free trial so you can use all the premium features of the tool at no cost.

5. Due

Payment processing software is another online tool you’ll want to better understand. If you’re running a business, that means you’re collecting payments somehow whether it’s billing clients or accepting funds directly for goods.

Summary

Having the right online business tools is important, but knowing how to best use them can make or break your business. Whether you’re paying for a tool or using it for free, take the time to make sure you fully understand all the features and how it works.

This way, you can increase efficiency and get more bang for your buck.

By Choncé Maddox     

Sourced from Business 2 Community

By 

You don’t need to wait for a new year to update your business’s processes. But when the calendar changes, it serves as a good reminder to evaluate some of the tech and platforms you use so you can modernize your business and become even more effective. Here, members of the online small business community share some of the trends and changes that you should be aware of as you bring your business into 2019.

Keep an Eye on PPC Changes

The world of PPC advertising is always evolving to better target relevant consumers. So if you want your ads to have the biggest possible impact in the new year, you need to stay up on all the latest trends. This Search Engine Land post by Ginny Marvin features some of the changes you should know.

Approach Analytics Differently in 2019

If you haven’t updated the way that you approach your business’s analytics in several years, 2019 could be the perfect time to re-think some things. Today’s businesses have access to more data than ever before. Here, Lane Ellis of TopRank Marketing discusses some of the ways you can approach analytics differently moving forward.

Learn These Google Analytics Terms

Google Analytics is perhaps the most popular tool for measuring website activity and traffic. But for those who are new to the online business world, some of the jargon used may be a bit tough to understand. So check out this Search Engine Watch Post by Robin Sherwood to get a handle on all the essential vocabulary.

Consider These Social Media Trends for 2019

If you want to stay on top of the ever-changing social media landscape, you need to constantly learn about the upcoming trends. In 2019, there are likely to be several evolving platforms and features that could impact your business. Learn more in this Prepare 1 post by Blair Evan Ball.

Keep Up With These Social Media Changes

And that’s not all! In this post on the Inspire to Thrive blog, Hugh Beaulac offers even more social media trends that should be on your small business’s radar in the new year. And members of the BizSugar community also shared their thoughts on the post here.

Build Your Small Business Credibility

Sometimes, small companies don’t have the same type of trust and credibility as big brands. But even though your business may be small, you can still reassure potential customers about your brand. This SMB CEO post by Matt Shealy includes some tips specifically for small businesses.

Protect Your Trademarks on Social Media

Just as it’s important to protect your business’s intellectual property in other areas of marketing and operations, it’s also important to do so on social media. There are plenty of accounts that may try to copy or emulate your trademarks. To protect them, read this Social Media HQ post by Christian Zilles.

Check Out These Landing Page Design Trends

Landing pages are very useful for targeting new customers and getting them into your sales funnels. The design choices that you make for these pages can have a major impact on your conversion rates. In this GetResponse post, Brea Weinreb details some of the upcoming trends that could impact your landing pages in 2019.

Become Gainfully Self Employed

Entrepreneurship is more popular than ever. Plenty of people are realizing the freedom and excitement of owning a business or becoming self-employed. If you’re interested in taking the leap this year, check out this Copyblogger post by Claire Emerson. Then see what BizSugar members are saying here.

Get Your New Business Idea Off the Ground

When you’re first jumping into the business world, you need a plan for developing and getting the word out about your new venture. There are many different factors that go into this process. To get started on the right foot in 2019, learn from this PERK Consulting blog post by Lucy Reed.

Feature Image Credit: Shutterstock

By 

Annie Pilon is a Senior Staff Writer for Small Business Trends, covering entrepreneur profiles, interviews, feature stories, community news and in-depth, expert-based guides. When she’s not writing she can be found on her personal blog Wattlebird, and exploring all that her home state of Michigan has to offer.

Sourced from Small Business Trends

Sourced from sritutorials

It’s that time of the year again: reflecting on the year that’s past as we prepare for 2019 lurking around the corner. In this article, we have a roundup of some of our fan favorite pieces from 2018 on SEO.

From how to’s to tips to tools, these were some of our highlights from the past year. SEW spark notes, if you will.

If you missed these pieces throughout the year, they’ll be worth a read. And if you’ve already read them, never hurts to refresh!

On Monday, we’ll have a roundup of our top articles on search industry news and trends.

1. How to force Google to recrawl your website

If you have launched a new website, updated a single page on your existing domain, or altered many pages and/or the structure of your site, you will likely want Google to display your latest content in its SERPs.

While Google’s crawlers are obviously pretty good at their job — indexing countless new pages simply from natural traffic and links from around the web — it never hurts to give Googlebot a little assistance.

In this article, we look at a few ways to alert Google’s crawlers to new URLs on your site.

2. How to set up event tracking in Google Analytics

Because one can never have enough Google Analytics insight, right?

One of the most useful features in GA, event tracking lets you capture all kinds of information about how people behave on your site.

In this article, we go step by step through two different ways you can set up event tracking: first, by adding the code manually, and second, by using Google Tag Manager.

This is a great tutorial for anyone looking to familiarize themselves with the task.

3. A quick and easy guide to meta tags in SEO

Meta tags help search engines and website visitors determine what the content of your page is about. 

They’re placed in the <head> section of a HTML document and need to be coded into your CMS. Depending on the platform you use, this can be quite less intense than it sounds.

Many “out of the box” solutions provide extremely user-friendly, labelled sections such as “meta description” calling your attention to exactly what goes where.

In this article, we take a look at why meta tags are important, along with the six main types of meta tags to focus on for SEO.

4. An SEO’s survival guide to Single Page Applications (SPAs)

For anyone who’s ever had questions about what SEOs should do with Single Page Applications (SPAs), this article is for you. Long, thorough, entertaining, and full of resources.

We start out looking at how the popularity of SPAs, Angular, and React have spiked in the last several years. Many developers eagerly embrace JavaScript for website development — and while that may have been rather inconsiderate of SEO ease (what else is new), it seems JS really is here to stay.

This article is bit of a coming to terms with that reality, accepting SPAs as part of our SEO future, and even dipping our toes in, if you will.

We look at what developers like about JS, how it was never intended for web page content delivery, common SEO problems of SPAs, and a host of other questions you might be asking.

Finally, we end with eleven recommendations for further reading — really, this could become the whole rest of your holiday break — on how Google treats SPAs, core principles of SEO for JS and for SPAs, and more information than you could want.

5. How to check your Domain Authority: 4 tools to use

Domain Authority (DA) serves as a handy heuristic in the SEO industry. It helps tell us how likely a site is to rank for specific keywords, based on the SEO authority it holds.

Many SEOs use Domain Authority to sense-check the quality of their inbound links and to understand how these are affecting their own’s site’s SEO health.

In this article, we round up some of the best ways to check out domain authority. We look at what factors go into DA, and how these tools go about calculating it.

‘Domain Authority’ was devised by Moz and they have naturally taken ownership of this name. Their suite of tools (some of which are discussed in this article) will reveal the authority of particular domains, but dozens of other free tools use Moz’s API to show these scores too.

6. 15 actionable SEO tips to improve your search rankings

This is another quite popular deep dive into SEO tips. We know “improving search rankings” gets a lot of fluff, but this is not that.

Here, we look closely at what makes RankBrain tick, and 15 ways to use that to your fancy.

Sections cover tips around optimizing keywords, optimizing title tags, optimizing descriptions, and reducing bounce rates and dwell times. Fun fact: research by HubSpot and Outbrain found that titles with brackets performed 33 percent better than titles without.

Questions about how to add LSI keywords? How long should long-form content really be? Benefits of long-tail vs medium size keywords? How much difference in clicks will a few characters too long in a headline actually make? All of that and much more (along with lots of screenshots) here.

7. 30 ways to market your online business for free

This article is a roundup of exactly what it sounds like — 30 ways to market your online business for free. It covers everything from emails to social media, from Google Analytics to Search Console, from forums to guest posting, from metadata to Schema.org.

While a few of the ways could be updated — posting to Google+, for instance, might be less helpful anymore — the list still provides some hefty inspiration to anyone needing a little boost of ideas for what to do online.

8. Four tools to discover and optimize for related keywords

This was a quite recent article that has soared. As we know, for SEO these days we need content that includes related concepts, satisfies intent, and provides value. The days of exact keyword matching are far behind us.

In this article, we have four great tools to use when optimizing for related keywords — and of course, how to use them.

For instance, the first tool in the list is TextOptimizer. It takes a term you give it, looks at the Google search results page, extracts snippets, and applies semantic analysis.

With that, it ouputs a list of all the related topics, terms, and concepts that form your topic cluster. From that cluster, it recommends you choose 15-25 of the words for a higher rank.

9. How to optimize your Google My Business listing

Lest we forget: local search.

For those looking to rank higher in searches tied to a user’s location — i.e. users that might be quite near your store and itching to buy something — a Google My Business listing is an essential first step.

This article gives a how to guide for first setting up your listing, claiming and verifying your business, filling out the information, and adding photos. From there, we go over gathering reviews, posting updates, monitoring your profile, and tracking data from Insights.

Of all the many, many things to do in SEO, optimizing a Google My Business listing is very straightforward. It can have a profoundly positive effect on your SEO — a whole wealth of ranking opportunity up for grabs.

Sourced from sritutorials

Sourced from Forbes

With so many companies relying on their websites to make sales and engage customers, it’s critical to understand how many people are visiting your site and what they’re doing once they get there. Monitoring your web traffic and page views can give you an idea of what’s working and what might require more effort. You can identify trends — like when users are most active and which content they engage most with — that help you better understand your consumers’ digital habits.

There are a lot of programs for monitoring, measuring and analyzing website activity, and it’s sometimes hard to know which ones to try. Below, 14 Forbes Technology Council members share their favorite tools and methods for the job.

1. Google Analytics

While there are many tools available to monitor web traffic, Google Analytics is free and comprehensive. However, while simply adding standard Google Analytics tracking code and reviewing basic traffic metrics is a good start, the real power of Google Analytics is unleashed when events are added to every link, button and action on a web page. This allows for a more extensive range of analyses. – Jonathan BabadDIRECTED

2. Ahrefs

Ahrefs is our go-to tool for monitoring traffic, domain authority and keywords. We can see which keywords are ranking the best and identify improvement opportunities to drive more traffic to our site. It also lets us see which sites are linking to us to identify potential guest posting partners, increase our backlink profile, and drive additional referral traffic. – Thomas GriffinOptinMonster

3. Matomo

Matomo (formerly Piwik) is an open source and self-hosted alternative to Google Analytics. Because of these qualities, it gives businesses complete access to raw tracking information so that any custom reporting can be generated. Going with a self-hosted option can avoid some of the privacy concerns of giving Google even more data on your users. – Matthew Kolb, SkilledNursingFacilities.org

4. Leadlander

It depends on volume and target audience, but for us, a tool like Leadlander works well because it lets us see which specifically named companies are visiting which pages. Even though it’s not 100% accurate, it’s good enough to give our account executives valuable ancillary insight into how their outreach efforts are progressing. – Chris MoustakasDevonWay

5. Clickback.com

Tracking website visitors to your website is very important. You can do this through Google Analytics, which is a free and commonly used tool, but having the ability to turn that data into valuable information — such as finding out what companies are visiting your website so you can potentially track them down — is extremely useful. My favorite platform for such a purpose is clickback.com. – Ruslan DesyatnikovQA Mentor

6. Heap

Google Analytics is the industry standard; however, there are tools like Heap that can help teams understand behavior much quicker — not to mention, they are sometimes easier for junior teams to start using immediately. You can couple these tools with business intelligence tools like Google Data Studio or Domo. I think there are many ways to get the data you are looking for and move on. – Mike SchmidtDovetale

7. W3Counter 

There are free and paid versions. The free one lets you track 5,000-page views a day across 10 websites, while the Pro account allows you to track up to 1 million views a month. I like how visual it is, and it shows me exactly what I need to know rather than having to hunt around. – Jon BradshawCalendar.com

8. Your Server Logs

Tools like Google Analytics provide helpful insights, but don’t forget to look at server logs for data that Analytics doesn’t show. Attacks, brute-force attempts, and click fraud aren’t reported in Analytics and can persist for years undetected if left unchecked. Have your IT department use log monitoring software to look for unusual trends and spikes in traffic (both free and paid) just in case. – Jason GillThe HOTH

9. Your Own Custom Analytics Module

If you’re looking for higher accuracy, you should build an analytics module yourself. Most third-party analytics tools are javascript-based and client-side solutions. This means you might not get data from some of your users. They might have javascript disabled. They might be using some ad-blocking plugins that block analytics tools as well. – Vikram Joshipulsd

10. Your Conversational Interfaces

Web analytics previously focused on how users navigated a complex jungle of pages. Today, AI-backed conversational interfaces can transform user journeys into streamlined, on-demand experiences. This increased user freedom to self-serve in one consolidated view means companies can gain actionable analytics insights into which journey designs best lead to product purchases or issue resolution. – Evan KohnPypestream

11. A Combination Of Tools That Tell A Story Together

Monitoring the web traffic and page views of a company website is very important, but getting a Google Analytics report each month will not tell the whole story. Marketing professionals will use several tools (Google Analytics, Ahrefs, Moz Tools, etc.) to track analytics over time, looking for trends that tell a story. This helps us take decisive action on what website changes need to be made. – Marcus TurnerEnola Labs

12. A Heat-Mapping Tool

I like the visual representation of heat maps that show me where people go on websites and how much time they spend there. It tells me so much more about what works and where to make changes. – Chalmers BrownDue

13. Year-Over-Year Data Reports

YoY calculations are particularly good for businesses with seasonal peaks. For example, air conditioning sales might peak in the summer and a retail business might peak during the holiday season. The YoY growth rate smooths out any monthly volatility and helps easily see long-term trends. You might find out that you’re doing better than last month, but you’re actually down compared to last year. – Abishek Surana RajendraCourse Hero

14. Any Tool That Serves Your ‘Why’ Of Data Tracking

The “how” is the easy part — the “why” is the important part. From easy and free tools like Google Analytics to very detailed behavior tracking like Lucky Orange to customer journey tracking, the tools are out there. It is most valuable to first decide why to track this and what decisions the data will drive. If you know the “why,” then the “how” will follow. – Timothy McGuireJ.S. Held

Forbes Technology Council is an invitation-only, fee-based organization comprised of elite CIOs, CTOs and technology executives. Find out if you qualify at forbestechcouncil.com. Questions about an article? Email

MORE

Feature Image Credit: Getty

Sourced from Forbes