Tag

Google Tag Manager

Browsing

By

Bounce rate is a scary thing for people that don’t know the ins and outs of this particular vanity metric. I consider it as a vanity metric since there are a variety of reasons, both good and bad, that can skew the numbers. However, bounce rate is still a metric that can help diagnose what’s wrong with your pages and even your site. How do visitors interact with your pages? Do they find what you’re looking for? Are they not satisfied with what you’re displaying? All of these can be answered by diving deeper into your bounce rate metrics. So, here’s what you need to know about bounce rate and how do you use it to deepen your understanding of your site.

What is Bounce Rate?

A website’s bounce rate is the percentage of users that left the page/site that did not take any further action after entering such as opening a link, clicking a CTA button, filling out a form, etc.

Users that exit immediately without taking further actions are aptly called “bounces”. Since they only opened your page/site then bounced immediately away. 

Where Can I Find My Website’s Bounce Rate?

Your website’s bounce rate is easily viewable in your Google Analytics account. You have to own or at least be able to view our website’s Google Analytics Property. 

Once you’ve opened your site’s GA property, easily maneuver to the Audience dropdown and click on Overview. You’ll immediately see your site’s bounce rate.

Where to find bounce rate in analytics

You can further refine it by checking a specific page’s bounce rate. You can even check the specific bounce rate of the devices used by your site’s visitors. 

What is a Good Bounce Rate?

A good bounce rate differs based on the industry your site is in. That’s why a single study about bounce rate won’t always apply to your website. So, here’s a helpful resource made by Custom Media Labs on benchmark bounce rate averages for different industries:

  • 20% – 45% for e-commerce and retail websites
  • 25% – 55% for B2B websites
  • 30% – 55% for lead generation websites
  • 35% – 60% for non-eCommerce content websites
  • 60% – 90% for landing pages
  • 65% – 90% for dictionaries, portals, blogs, and generally websites that revolve around news and events

You need to remember that these are the industry standards, so if your site’s bounce rate is either higher or lower than the average then there might be something to improve or fix on your site and/or page. So, what are some of the common causes for having too low or too high of a bounce rate?

Why Your Bounce Rate is too High or Low

There are a variety of factors that affect your bounce rate – most of them include on-page factors that you can easily fix, improve, or change. They include:

Site Speed

A slow-loading page or site can be a definite reason for visitors to bounce. Aside from negatively affecting your bounce rate, a slow loading speed will also affect your site’s rankings. Why? Because Google has stated the importance of better page loading speed since it will be a part of the Page Experience Update that will be rolled out in 2021. 

So, not only will you improve your bounce rate by speeding up your site, but it will also help you adjust to the upcoming algorithm update. To help you start, here’s a complete guide on optimizing for the core web vitals – an integral part of the page experience update. Additionally, there is a multitude of resources that you can use to check your site’s current loading speed.

Title Tag and Meta Description

Maybe the problem isn’t what’s on your page, but what the users see before they enter your page. Your page’s title tag and meta description is the introduction to your page – it sets the expectations of the user, and it’s their first impression of your page. This means that what is contained in the title tag and meta description will be the one dictating what they expect to see inside your page. So, if your page does not align with what your title tag and meta description says, that’s an automatic bounce. 

Misleading title tag and meta description is a simple problem to fix since you have direct control over these factors and you can search for a keyword that the page ranks for to check how it looks in the SERPs. Either align what is contained in the content with your title tag and meta description or adjust the meta tags to better fit the content of the page.

Low-Quality Content 

Aside from having misleading meta tags, another possibility is that your page’s content is not up to par with what the user wants to see or it simply does not contain the answer they were looking for. 

This is where search intent and proper content optimization comes into play. Why? Because when you have a proper understanding of these two facets, it will help you create specialized content that users would want to see. 

Mobile Optimization

On a more technical aspect, it is possible that your website is not properly optimized for mobile. This is especially alarming in this day and age where most of the searches are made through mobile devices. 

So, if your site is not mobile-optimized, this means that the design is low-quality, text may be hard to read, and gives an overall bad experience to the visitor. 

Work with your developers to avoid this particular instance since this is much like the slow loading speed wherein it does not only lead to a negative bounce rate, but it also affects your site’s rankings.

UI/UX

Another technical aspect of your site is its UI and UX. Is the site’s design pleasing to the user’s eyes? Is navigation to specific pages easily achievable? Do the design elements not interfere with your visitor’s experience in your site? 

Those are just some of the things that you have to take note of when it comes to understanding bounce rate since there will always be times where you won’t be able to determine which factor negatively affects your bounce rate until you think about the page or site’s design at the end. 

Google Analytics or Google Tag Manager

Lastly, bounce rate is calculated by Google Analytics. This means that proper implementation of the GA or GTM tag is essential to having an accurate bounce rate. There are multiple instances where the improper implementation of your GA or GTM code can lead to skewed analytics data, such as:

  • The tag was installed multiple times in the site’s source code which leads to multiple hits being fired when only a single user entered your site. This significantly lowers your bounce rate which is, simply, skewed data.
  • Not all pages have the tag installed in their source code. This means that the data you’re seeing in your Google Analytics account is skewed as well.

Key Takeaway

Bounce rate is not the metric you want to be using to measure the success of your website and even your SEO. But that does not mean that it has no potential uses. A bounce rate is a metric that will help you gain deeper insights into how users interact with your site. How your content fares, your new design or pop-up, etc. All of these can be measured using bounce rate, among other data. 

It’s up to the SEO and webmaster how they gain those important insights and how they use bounce rate as a stepping stone to improve their site’s performance and search success. What’s your experience with bounce rate? Let us know in the comments below!

By

is a Filipino motivational speaker and a Leadership Speaker in the Philippines. He is the head honcho and editor-in-chief of SEO Hacker. He does SEO Services for companies in the Philippines and Abroad. Connect with him at Facebook, LinkedIn or Twitter. Check out his new project, Aquascape Philippines

Sourced from SEO HACKER

By

f there is an unsung hero in Google Analytics, it is definitely something called content groups (or content grouping). Never heard of it? It is hiding in plain sight, in your Google Analytics view settings, and can be set up in a couple of clicks. Once content groupings are set up, you will always want to use them.

Ready? Get some coffee, snacks, and let’s go build some content groups.

What are content groupings in Google Analytics and what do they do?

Simply put, content grouping allow you to create… wait for it… groups of content. Many times you will want to see consolidated reports on multiple elements and dimensions without having the possibility to see them grouped together as one entity.

Imagine you run a bilingual site like this blog but don’t necessarily have the URL structure to distinguish between languages. Imagine you run a news site made up of content sections such as politics, finance, sports, culture, etc. Imagine you run an e-commerce site with departments and product categories.

In the case of the multilingual blog, I want to see an overall view of my content’s consumption in terms of language.

In the case of the news site, I want to see which sections were read the most and which were read next.

In the case of the eCommerce website, I want to see whether my users are browsing within the same product category or exploring other products.

Creating content grouping

First things first, go to your Google Analytics admin panel and locate your view, as shown below:

You should be seeing an empty table, but I’ll show you how mine looks in the test view we’ll be playing with:

List of content groupings in Google Analytics

As you can see in the example above, I’m using up all 5 content groups allowed per Google Analytics view. I can create more groupings in another view if needed.

In your case, you should have a big red button called New Content Grouping . Click it. CLICK IT NOW.

The first thing we’ll do is give the new content grouping a name. If we use the eCommerce website example, let’s imagine it’s a clothing store – with 3 major sections: women’s clothing, men’s clothing and children’s clothing. With that in mind, let’s name the new content grouping Product section.

Next, I have to choose from three options in order to give my content grouping a value:

  1. Group by tracking code: relies on what information is sent to the Google Analytics tracking call, using Google Tag Manager for instance. This implies your tracking code / data layer includes the information required, with a productSection dataLayer entry for instance. Probably the safest option, assuming you can handle the related development.
  2. Group using extraction: here we’ll be looking at patterns in URLs and capture the strings in the URLs that match the pattern. Expect to use regular expressions.
  3. Group using rule definitions: with this option we can specify a value that applies when conditions are met, based on URL, page title or screen name. Basic but powerful, assuming you’re ready to handle lots of unique cases.

Actually, let’s tackle them in reverse order!

Group using rule definitions

This is going to be the most common way you use content groupings. Why? Because accessing your site’s URLs is the easiest way to find patterns and use them to create logical groups.

For instance, If we want to give our Product section content grouping a value based on URL rules, we can create a new rule. As shown below, we are creating a value of “Kid’s clothing” for pages where the URL contains /kids or /children. Yes, you can use regular expression as well as AND and OR conditions, which make rule creation a breeze.

Creating content grouping in Google Analytics based on rule definition

Another example is what I use to measure how much content on my site is served as AMP.

The above definition means I can now look into my Behavior > Site Content > All Pages report and use my content grouping as the main dimension:

Using a content grouping as main report dimension

Then once you select your content grouping (AMP in this case), your report shows you that consolidated view you’ve been waiting for:

Neat, right?

Group using extraction

We got the fun part done with the previous grouping method but the extraction method can be interesting too! In the example below, we use a regular expression to capture part of the URL folder structure that immediately follows the /products/ folder. In our case we assume URLs in the form of /products/mens/shirts.html. As with regular expressions, whatever sits inside the parentheses is captured to be used later. If the regexp is set to /products/(.*)/.*.html and using the above test URL, we’re going to captures mens and store it as the value for our content grouping.

Sounds straightforward, yes? Good – now for the best bit.

Group by tracking code

Grouping by tracking code is a lot more elegant, especially if you work with a tag management system such as Google Tag Manager. Essentially, you need to select your content grouping’s number (index) from 1 to 5 and pass a value to it.

Let’s examine the Google Tag Manager methodology. Assume you can generate the following data layer for any given page:

var dataLayer = window.dataLayer || [];
dataLayer.push({
  "productSection": "Men's clothing"
});

In Google Tag Manager, create a variable based on your productSection data layer variable:

Next, in your Google Analytics page view and event tags (or even in your Google Analytics configuration variable), setup your content group to use your new variable:

Using Google Tag Manager variables to populate content groupings in Google Analytics tag

Publish your GTM container and voilà! You have an elegant solution for content grouping that does not rely on URL-based rules and can easily integrate with your content management system.

But wait, don’t we have custom dimensions for that?

Ah, an astute remark! Custom dimensions are indeed available for a similar purpose, with the addition of specific scopes (user, session or hit), whereas content groupings are hit-based. Furthermore, custom dimensions are pretty much expected to be set in the tracking call, whereas content groupings can be set using URL rules, extraction, or tracking code, making them a bit more flexible than custom dimensions.

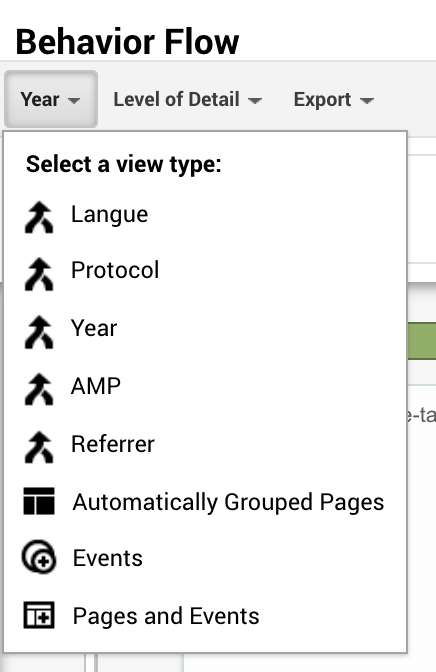
As mentioned before, the main advantage of content grouping over custom dimensions is pathing. You can see how content grouping can be included in a flow-type report:

If I use my content publication year content grouping, I can see if users navigate from older to newer posts or the other way around:

Using content groupings as high level navigational elements

Of course this method works great with the news site or ecommerce site examples I mentioned earlier.

In closing

If you hadn’t heard about content grouping in Google Analytics before this post, something tells me you’ll be using them very soon.

By

Sourced from https://juliencoquet.com

By Brett McHale

One area that seems to elude many digital marketers is the relationship between conversion tracking and website analytics. Often, when businesses get started with online advertising, they have established each piece of the puzzle separately, with Google Analytics monitoring site traffic, and paid channels (like Facebook and Google Ads) tracking conversions individually within their respective dashboards.

This set-up may be effective on a small scale, but it will inevitably cause issues when your efforts expand. Having the proper tracking to view granular paid channel performance in Google Analytics will allow you to add another layer of attribution to hold each channel accountable for what’s really happening on your website.

In addition to Analytics, Google offers tools to streamline the process of managing website pixels and conversion tracking for each channel. With the combination of clean conversion tracking and reliable analytics, you should be able to scale your paid programs without having to worry about whether the information you’re looking at is accurate.

In this post, I’ll walk you through how to use Google Tag Manager and Google Analytics to improve your paid channel performance reporting in four steps.

Step #1: Implement Google Tag Manager

Google Tag Manager allows you to implement and manage the tags on your site in one place. This means you only have to place a snippet of code once across your site as opposed to manually inserting a tag from every channel individually. After the GTM tag is implemented, you will be able to add and manage tags all in one place. The reason I start here is that many advertisers will manually place each paid channel’s tracking pixel individually on the pages of their website. This can create confusion and clutter within your website’s code. To simplify the process of adding multiple pixels and tracking codes to your site, I highly recommend setting up Google Tag Manager as soon as you can. This will also make the life of your future web developer much easier if your team and operations scale.

To get started with tag manager you’ll have to create an account.

getting started with Google Tag Manager

Once there, you’ll want to follow the steps for establishing your account information. Name the account after your business and continue to set up the “container.” The container will be your website address:

set up Google Tag Manager account

You’ll want to select “web” before proceeding. Google will then generate two tags for you to place across your site.

install Google Tag Manager

The top tag will be implemented within the <head> and the second after the opening <body> tag. It’s a good idea to copy and paste these tags and save them in a document so that you can easily access them at any time. If you use a platform like HubSpot to manage your site, it’s rather simple to apply these tags across all web pages quickly.

Keep in mind that if you use a third party for landing pages, you’ll want to have this code injected there as well.

Before you implement the GTM tag across your website, you’ll want to remove tags from any paid channels that had been previously manually installed. You will be able to transfer these tags to GTM afterwards, but removing them in the meantime will ensure that those tags aren’t firing multiple times or causing issues once the GTM tag is in place. It’s also a good idea to save these pre-existing pieces of code in a document – I’d suggest the same one that you have the GTM tags in for safe keeping. If you are managing accounts for clients, make sure that they give you publishing permissions in their GTM. This will allow you to create new tags and publish them on your own.

For Facebook, there is a quick way to implement the pixel into GTM. After you finish setting up your Tag Manager account and remove pre-existing paid channel tags from your site, go to Facebook Business Manager and select “Pixels” from the main drop-down menu:

Facebook Pixel

Select “Set Up Pixel”:

select "Set Up Pixel"

Then select “Use an Integration or Tag Manager”:

Google Tag Manager pixel options

This should then allow you to choose Google Tag Manager from the list and follow the walkthrough to easily implement the pixel. In Google you can add your conversions by going to Tools > Conversion > and then selecting the specific conversion you would like to add. At the bottom of the page there should be an option for “Tag Setup.” There you will be able to select the Google Tag Manager:

choose to install using Google Tag Manager

This will provide you the information you need to create the conversion in Google Tag Manager. This includes the conversion ID and conversion label.

To create a new tag for any channel, select “New Tag” from the Google Tag Manager home screen and then choose the channel you want to set up:

Google Tag Manager home

When doing so you will be prompted to choose how each tag fires or when it is “triggered.” For Tags like LinkedIn, Facebook, and Google Remarketing, you’ll want to set them to fire on “All Pages”:

LinkedIn Insight

For something like Google Ads conversion tracking, you’ll want to have the tag fire only on specific page URLs:

choose specific pages for trigger configuation

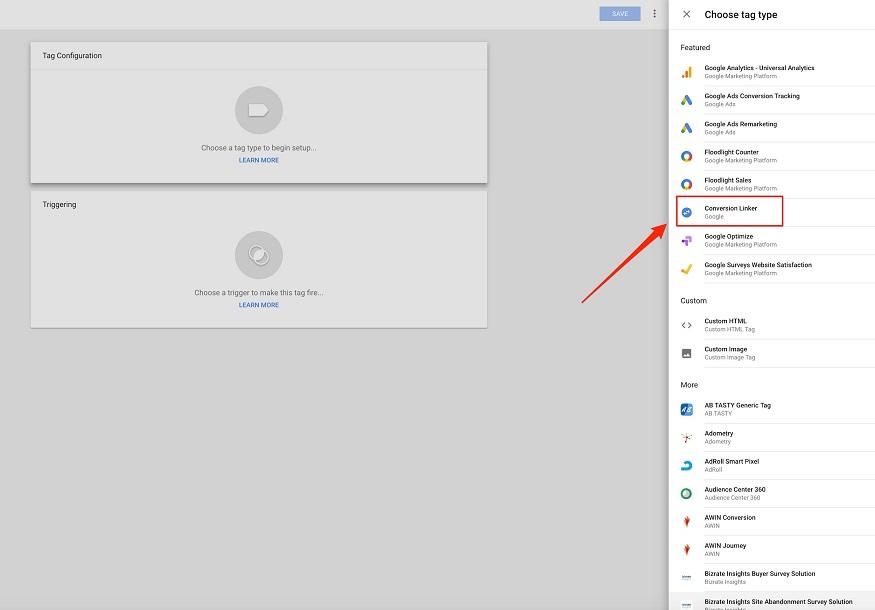
Here, you can specify which pages you want the conversion to fire. For example, “thank you” pages or any destination page associated with the conversion. After doing so, you also have the option to add a conversion linker to the pageview event. Conversion linkers are used to help tags measure click data so that conversions are measured effectively. To add a conversion linker tag, simply select “New Tag” and “Conversion Linker” from the tag configuration menu:

Google Tag Manager configuration menu

Then you’ll want to have the linker trigger to “All Pages.”

Once you add in your tags from each respective channel, select the “Submit” button at the top of the page. This will push the changes you made to Tag Manager Live:

push tag manager live

To ensure that your GTM is firing properly, I suggest downloading the Google Chrome extension Tag Assistant. This plug-in will allow you to see which tags are live on specific web pages.

You can also get the Facebook version of this tool to ensure those tags are firing as well.

To use these tools, go to your website and enable the Tag Assistant extension:

Tag Assistant extension

Here you can see the two tags are in place and firing. This is a good way to ensure you removed old tags properly without having to dig through each page’s code.

Step #2: Set Your Google Analytics Goals

The essential piece of the reporting puzzle is tying Google Analytics Goals back to your efforts in paid media. In case you haven’t established Google Analytics Goals yet, I’ll walk you through the process.

Sign into your Google Analytics account and select the proper view for your website. On the left-hand side, select “Admin” (FYI, you’ll need to have admin privileges in order to create goals in Analytics).

go to Google Analytics Admin

After that you’ll want to select “Goals” from the desired view:

select Goals in Google Analytics

From there you can view existing goals or create new ones. You’ll want to ensure that the goals that exist or the ones that you create are synonymous with your paid advertising conversions, like demo requests, ebook download, free trial start, purchase, or add to cart. You have a few options when it comes to creating the types of goals you want, including goals from a template, custom goals, and smart goals. I recommend creating custom goals because they allow you the flexibility of specifying destination URLs:

select goal type in Google Analytics

The idea here is to create goals that are identical to the conversions you have in place within your paid channels. For example, if you are driving traffic to an ebook landing page on Facebook, then you will want to have ebook “thank you” pages established as goals within Analytics. In a scenario like that, you’ll want to select “Destination.” From there you will be able to specify the destination landing page for the conversion event in the same way you would in your paid platforms. Assuming Tag Manager is properly established, you will be recording conversions within each individual channel respectively – with goals set up in Analytics for those conversions, you can now use Analytics to compare and ensure that the results are comparable.

Step #3: Start Using Analytics URL tracking

In order to see the specific source of traffic in relation to the goal completes, you can use Google’s URL campaign builder.

Here, you can create unite URL UTM parameters for each specific paid channel campaign. Under “Campaign Source,” you can put the respective channel (Facebook, Google, LinkedIn, etc). After having everything set up and your campaigns running, you can then go to “Goal Flow” underneath the “Conversions” section in Analytics:

select Goal Flow in Google Analytics

From there, you can then select one of your custom goals in the top right and view the amount of goal completes from each respective channel. For example, ebook downloads:

example of goal flow in Google Analytics

There are other ways to get channel visibility like this, but I found this to be the simplest way to do it.

Step #4: Keep Track of Your Reporting

After you have Google Tag Manager and Google Analytics set up for your desired conversions for each channel, you’re almost done. Because you’ll be able to see what channels are driving which goals, you’ll want to make sure you’re keeping on top of regular reporting to make the most of this information.

If you’re seeing numbers that are not aligning to your reports in Google Analytics from Facebook, for example, you can go into your custom conversions and see if there is an issue there (on the Facebook level). The idea is to make Google Analytics your source of truth when tying back costs from your paid efforts. You will also be able to use Analytics to monitor page traffic and the associated metrics for pageviews and bounce rate (this comes in handy as Facebook’s click data is usually far from accurate). You will also be able to get insights into how users are interacting with the rest of your site after entering through a paid channel. For example, a user lands on your site through and ad but navigates to another page and converts. You will be able to see this information and tie it back to the overall paid ROI.

If you want to consolidate all of this data into one simple dashboard, consider using a tool to connect your accounts and create reports automatically. Some good options include Databox, OpenStack, and WordStream Advisor.

With Google Tag Manager and Google Analytics goals working in harmony, your paid channel reporting will become streamlined and a lot more accurate. If you ever wondered what results you actually received from paid advertising, having these systems set up is the first step towards clarity.

By Brett McHale

Brett McHale is the founder of Empiric Marketing, a digital marketing agency dedicated to scaling startups through paid search and social.

Sourced from WordStream